AAVE, Litecoin and Bitcoin Price Analysis: August 13
Bitcoin’s recent push to $47,052 had a ripple effect on altcoins such as AAVE and Litecoin. AAVE inched closer to breaking above $424 resistance while LTC noted a 6.3% jump over the last 24 hours.
AAVE
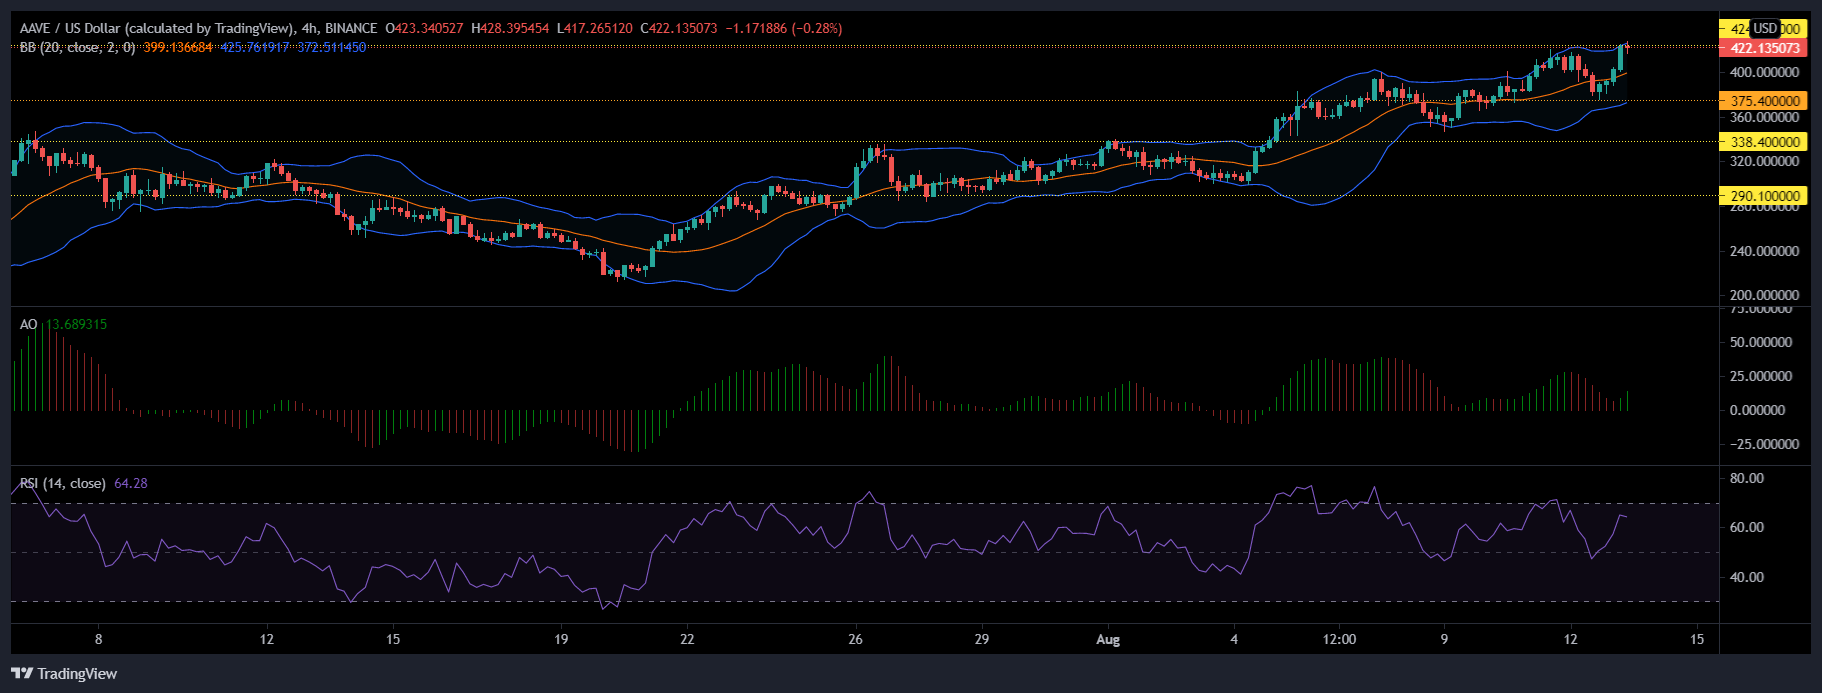
AAVE rose by 3.4% over the last 24 hours, prices stood at $422.13. Indicators flashed bullish signals and if AAVE toppled over the immediate resistance at $424.00, it could aim for $444.27.
Awesome Oscillator read green signal bars which indicated bullish movements on the chart. Relative Strength Index remained positive as it was seen around the 60-mark, despite noting a small downtick.
Bollinger Bands ran parallel, with negligible constriction, suggesting that market volatility would remain low over the next few trading sessions. In case of a reversal, the first support line stands at $375.40.
Litecoin
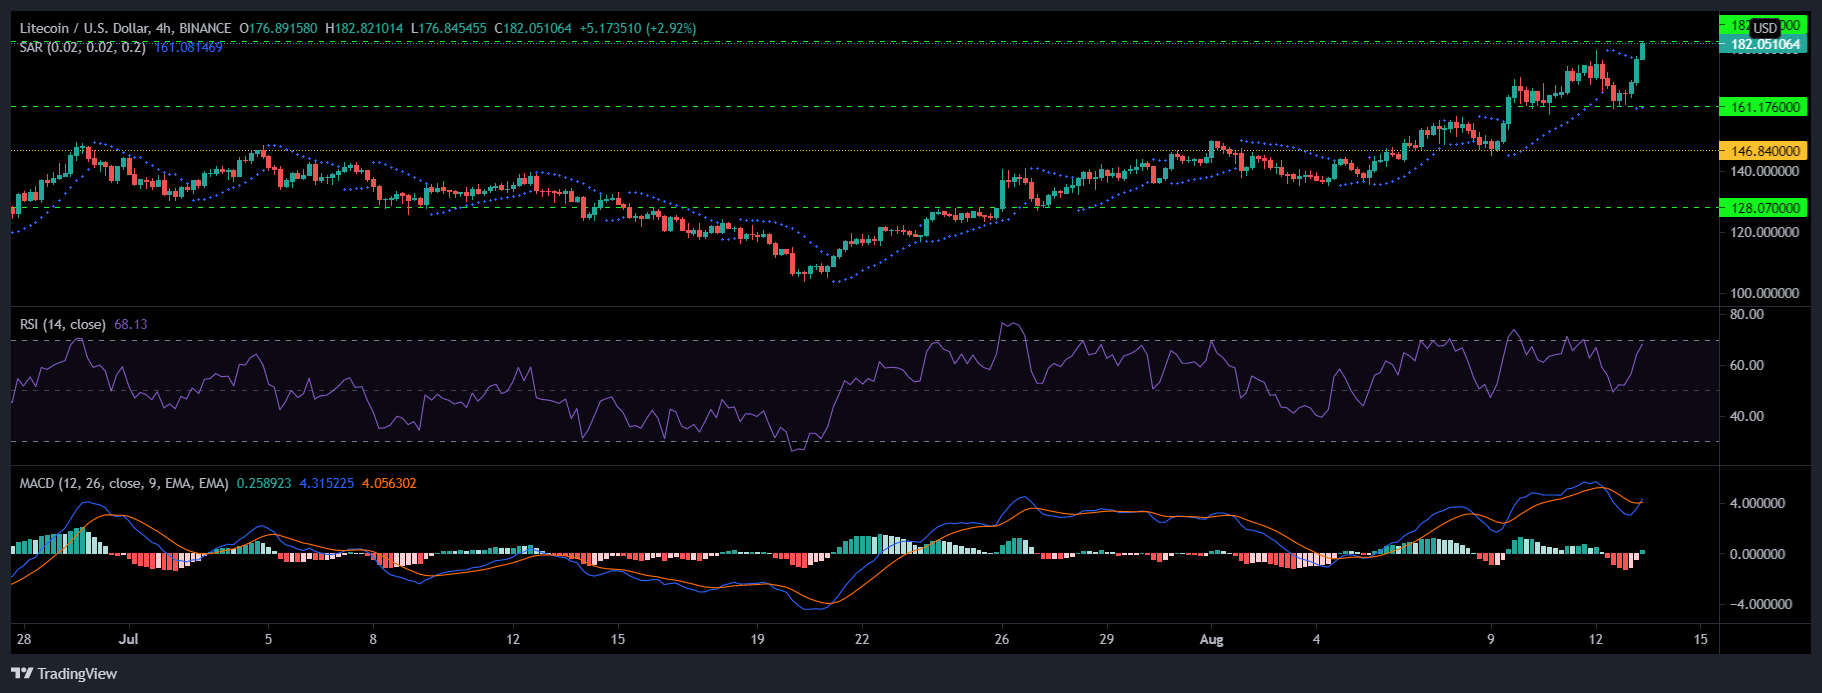
Litecoin registered a 6.3% rise in prices since yesterday, it was valued at $182.05. A jump above the current resistance of $182.56 could push LTC to challenge $194.44; a level last touched in June.
Buying pressure shot up, as seen on the Relative Strength Index. If LTC maintains its bullish stance, it could head straight into the overbought zone. MACD also displayed an onset of bullish price movement as it displayed a green histogram, post a bullish crossover.
Parabolic SAR noted dotted lines underneath the price candlestick, a reading that signified price uptrend. In case bulls fail to sustain momentum, support level rests at $161.17.
Bitcoin
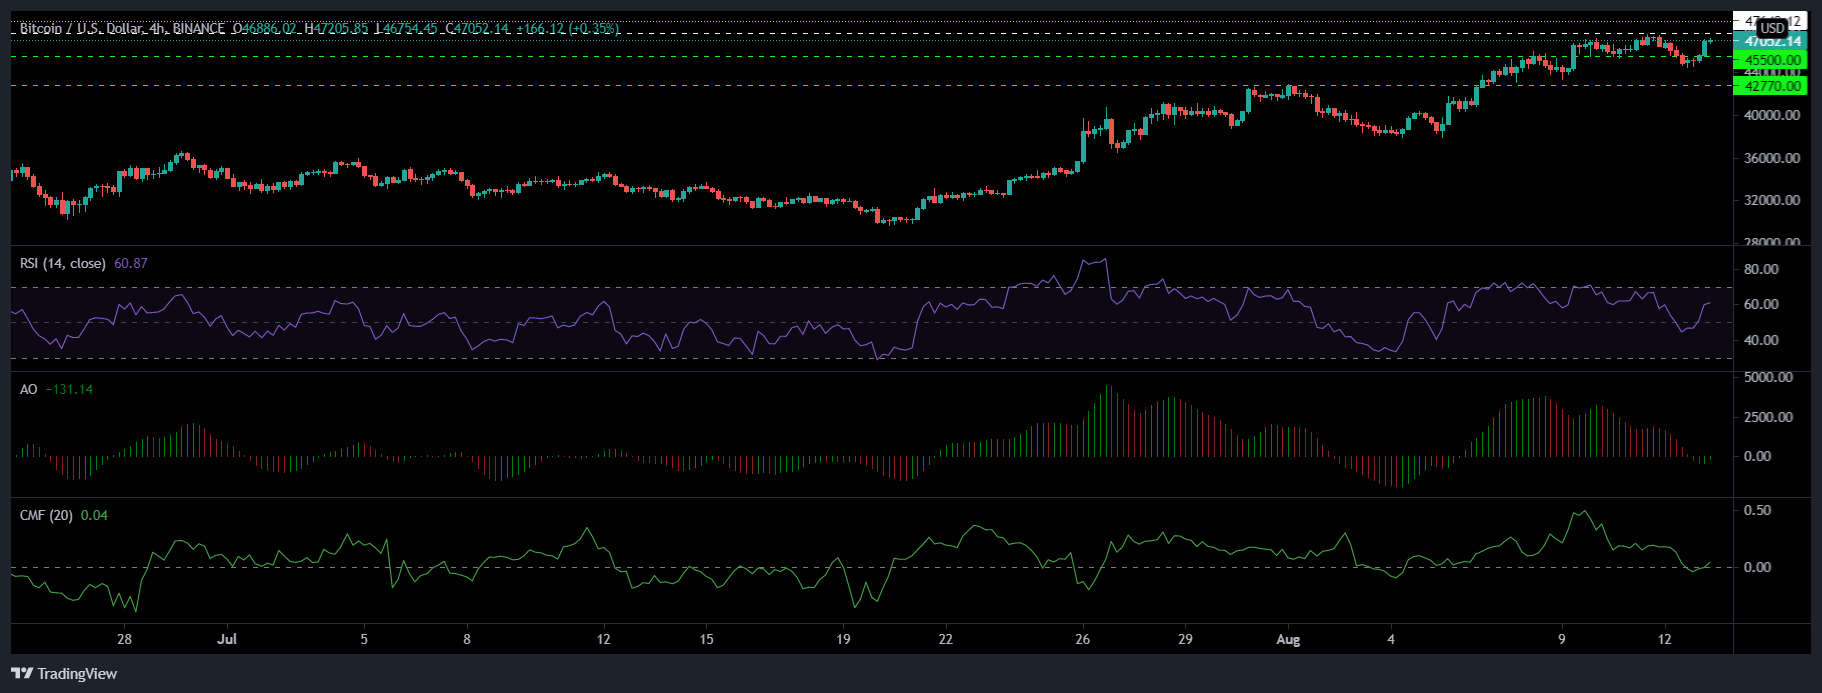
Bitcoin stood at $47.052 on the back of a 3% hike since yesterday. Price today hovered around the $46K mark. This northward movement came in after the new developments in the US infrastructural bill. The next resistance level for BTC is at $47,800.
Awesome Oscillator noted the emergence of green signal bars. Relative Strength Index stood at 60, which highlighted an increase in buying pressure. Chaikin Money Flow also noted capital inflows as substantiated by the tiny uptick above the midline.