Binance Coin, Litecoin and Chainlink Price Analysis: August 12

As Bitcoin and Ethereum registered a slump in prices by 2.2% and 2.8%, respectively, altcoins such as BNB, LTC and LINK started to undo their gains on the charts. BNB declined after it tried to test the $402 resistance; LTC managed to float above its immediate support level of $161.19.
Binance Coin
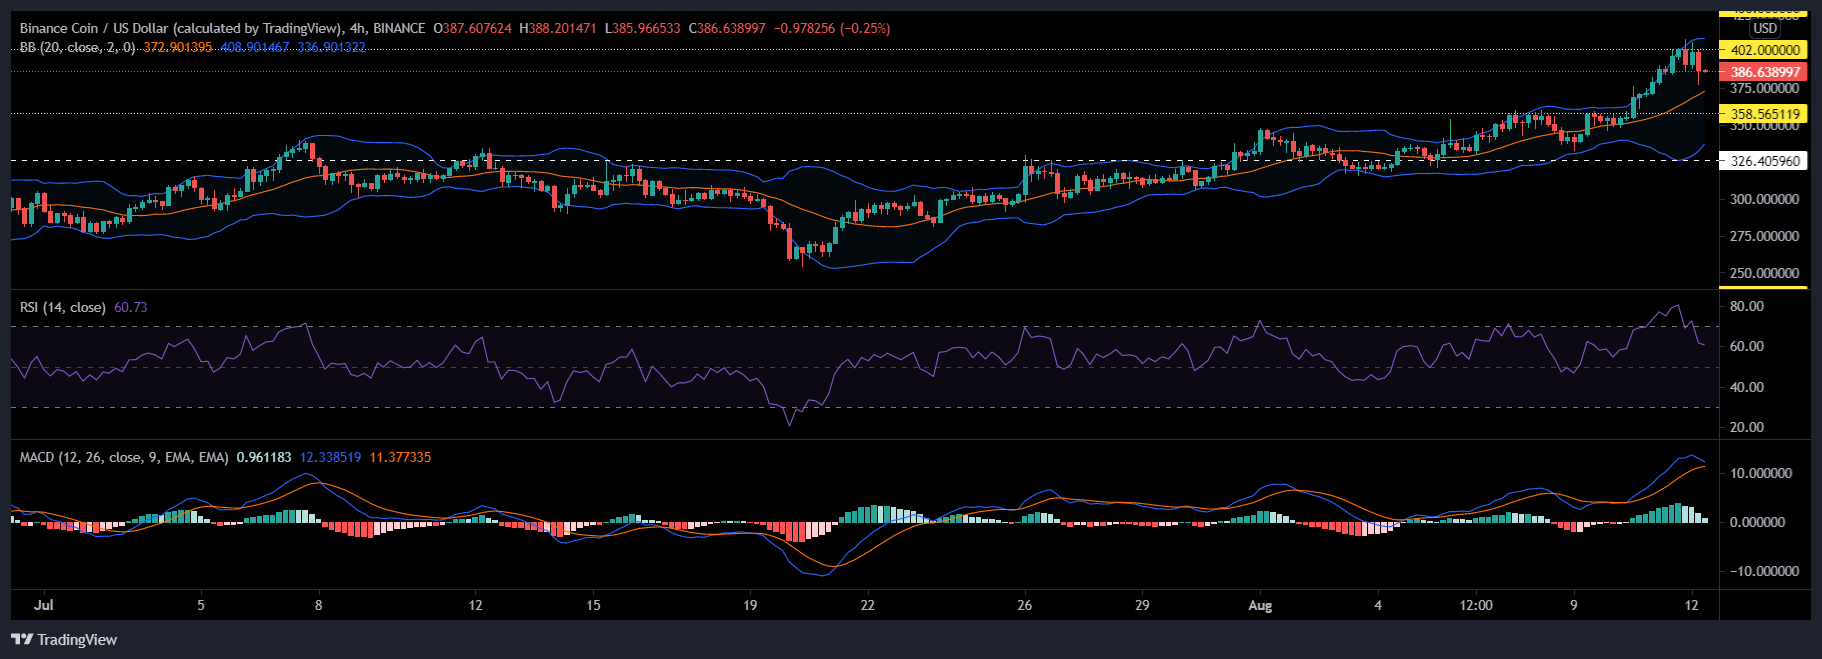
On the back of a 1.58% decline over the last 24 hours, BNB’s value stood at $386.63. After BNB rose to a multi-month high of $400, the asset noted a slight dip as BNB might be aiming to rest on the $358.56 price floor. The technicals, however, flashed mixed signals for BNB.
Relative Strength Index dipped and touched 60 after being in the overvalued territory, despite the fall it still remained bullish. MACD neared a bearish crossover which indicated a halt to BNB’s upward trajectory.
Market Volatility was also on the up according to Bollinger Bands. On the contrary, if the bulls do not give up ground, BNB could retest $402 resistance.
Litecoin
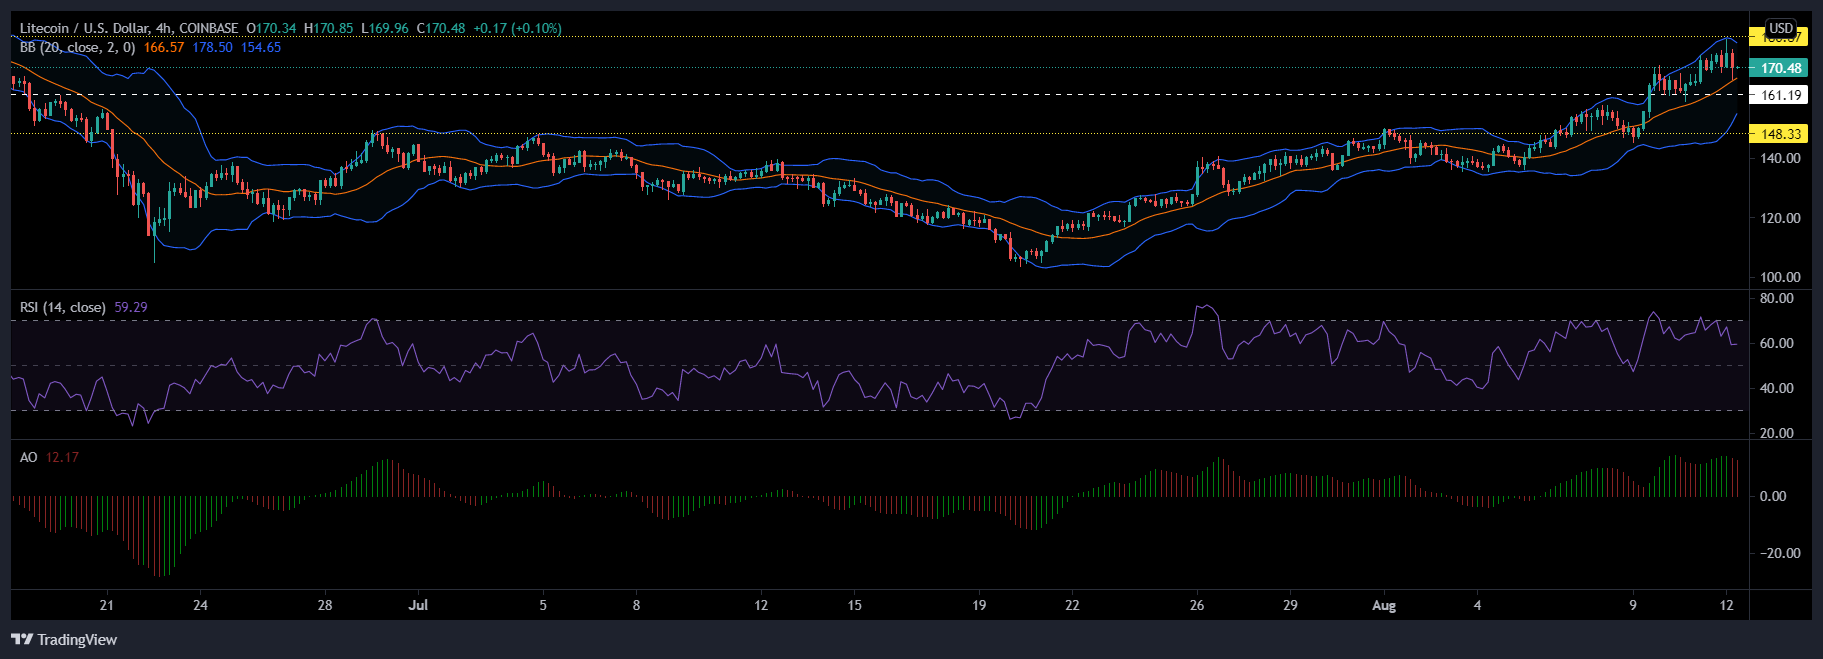
LTC fell by a marginal 0.7% over the last 24 hours. Renewed bearish pressure was spotted on Awesome Oscillator, the result of which could push LTC towards its support line of $161.19.
Relative Strength Index also mirrored a decline in bullish momentum but maintained above 60. Bollinger Bands constricted slightly and indicated some sideways movement for LTC over the coming sessions.
In case of a reversal, LTC would target a climb towards $180.87.
Chainlink
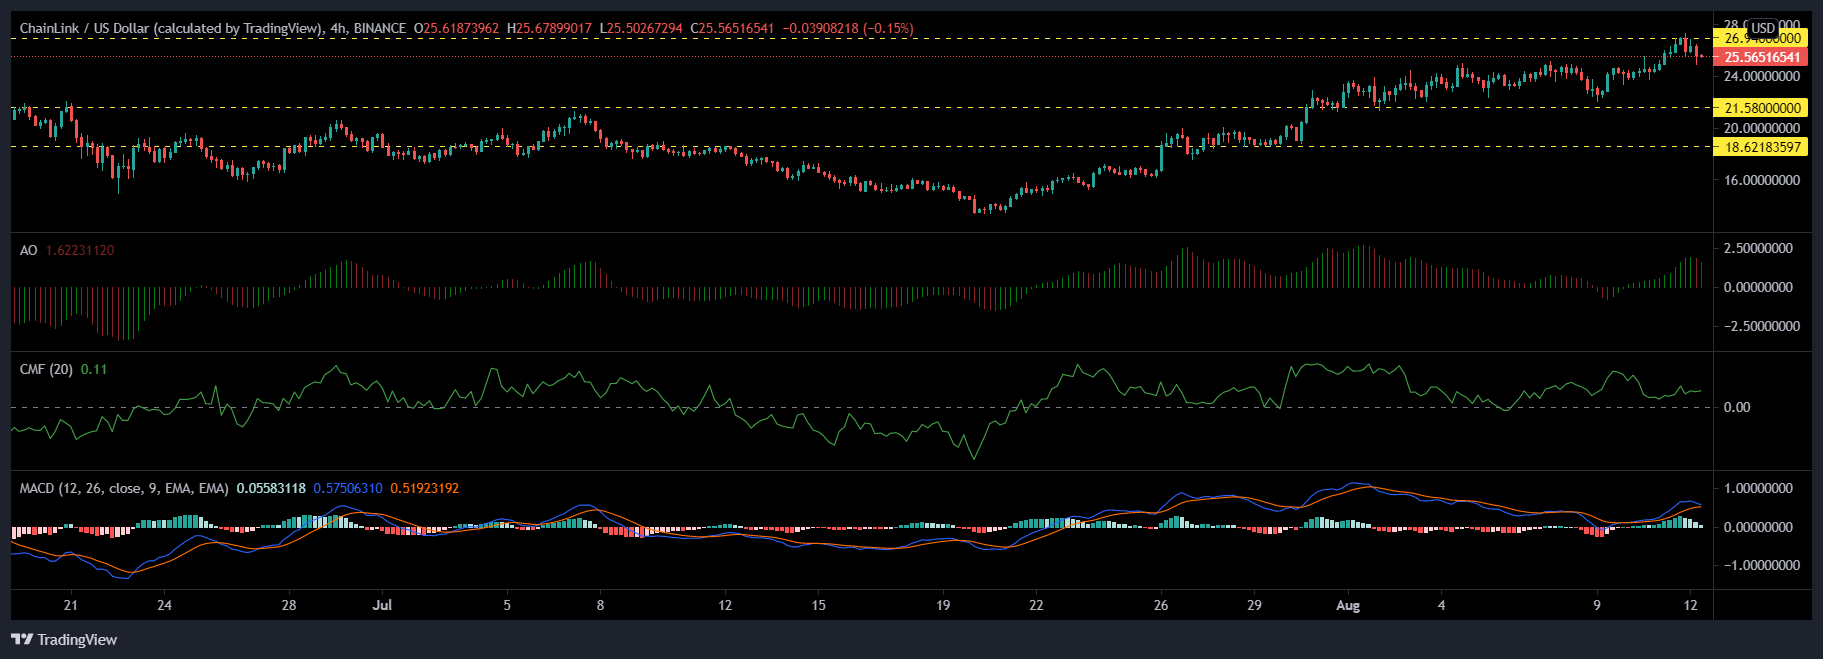
LINK depreciated on its charts by 0.4% over the last 24 hours, it was priced at $25.56 at the time of writing. In case prices remain in the current region for upcoming trading sessions, LINK could test the $21.58 support level. However, the 4-hour chart of LINK still emanated the presence of bullish sentiments.
MACD approached a bearish crossover and could move below the half-line. Additionally, although capital inflows declined in comparison to outflows, Chaikin Money Flow remained flashed a bullish outlook.
Awesome Oscillator, on the other hand, noted red signal bars at press time. A bullish trend for LINK could see prices touch the $26.94 ceiling again for the second time.