All the ways in which BNB’s face-off with this resistance level will unfold

Disclaimer: The information presented does not constitute financial, investment, trading, or other types of advice and is solely the writer’s opinion.
- Higher timeframe downtrend
- BNB heads into a stiff resistance zone
Binance Coin is the 4th largest cryptocurrency by market capitalization. The exchange token has seen sideways movement on the price charts for nearly a month now as it formed a range between $260 and $300. At press time, the price approached the psychological $300-resistance once more.
Here’s AMBCrypto’s Price Prediction for Binance Coin [BNB] for 2022-23
Despite the bullish momentum of the past few days, however, Binance Coin could see a strong rejection, especially if Bitcoin also faces difficulty in climbing above $20.5k.
Binance Coin runs into seller territory
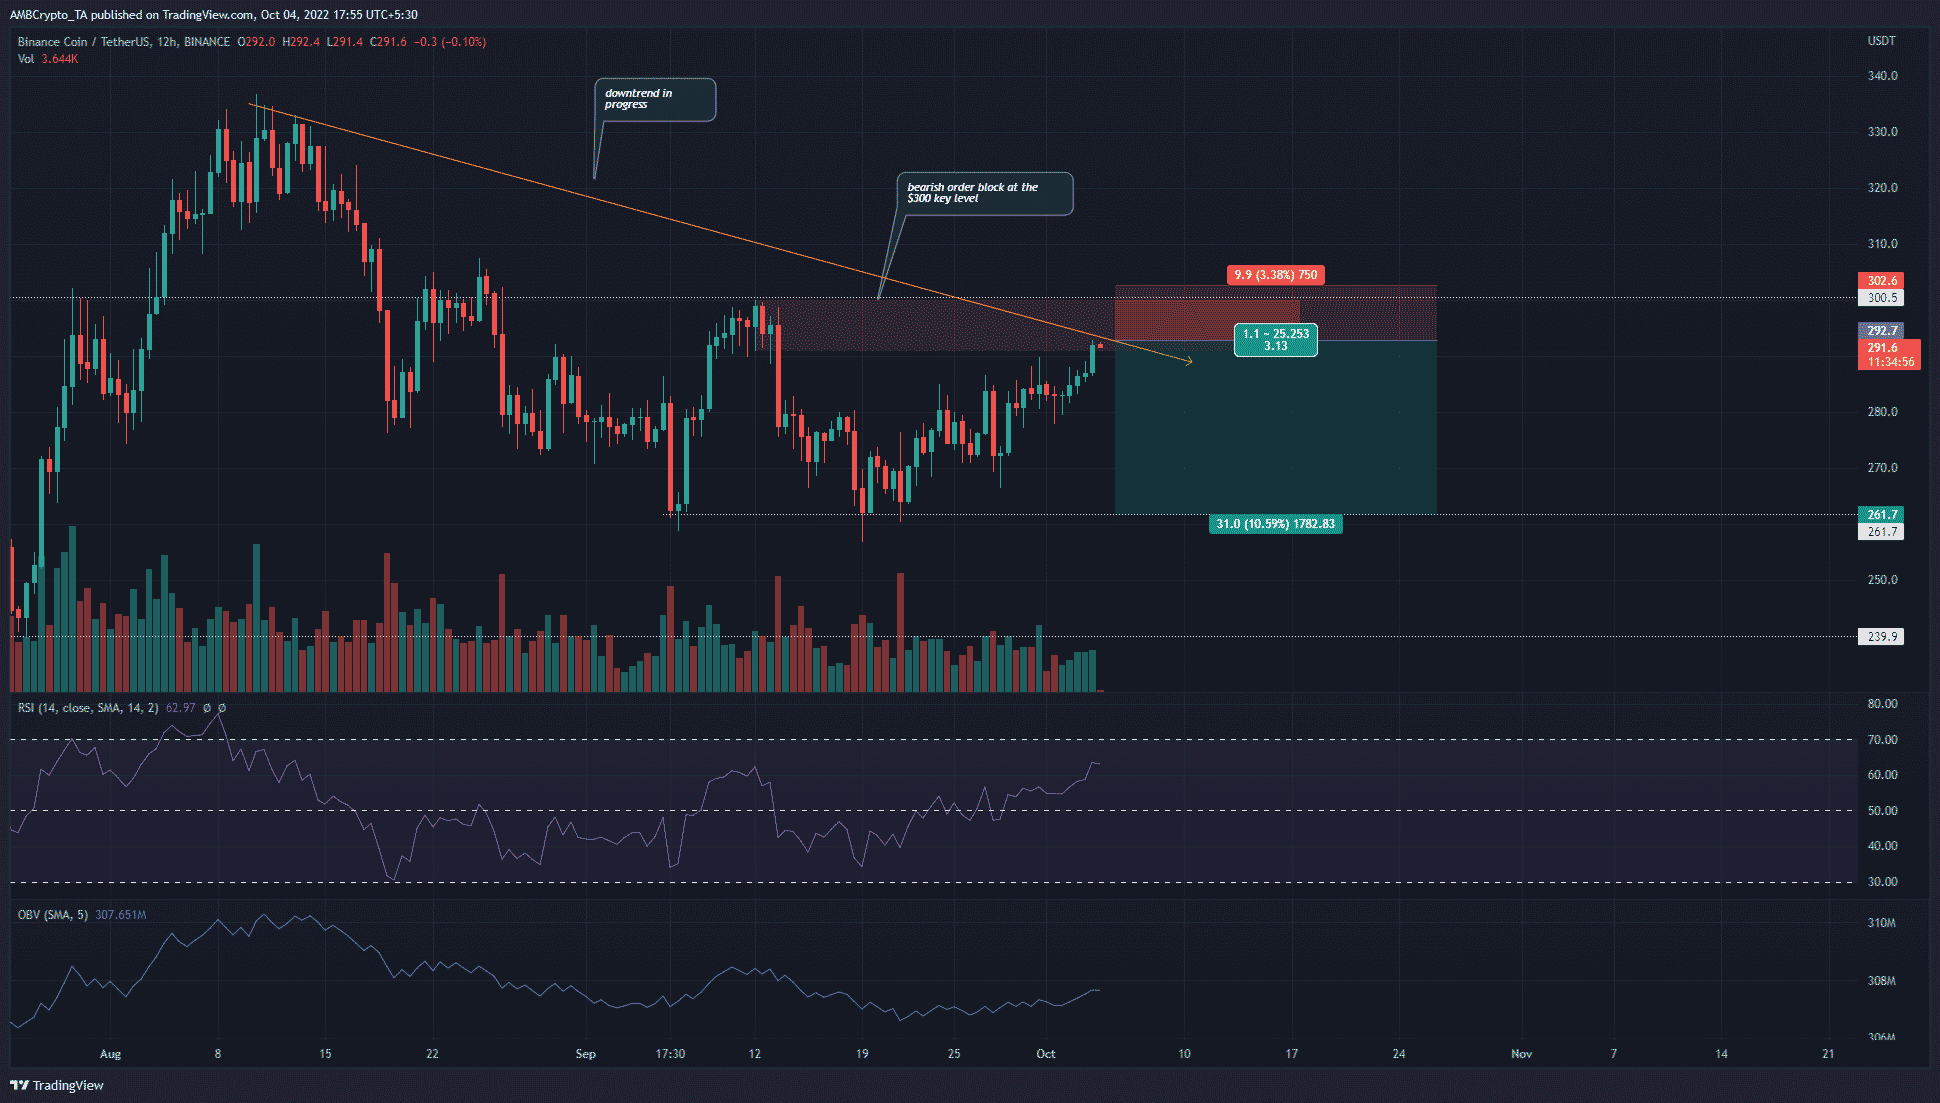
The 3-day chart (not shown here) had a bearish market structure. The daily structure was also bearish for BNB, although its move past $280 carried some lower timeframe bullish impetus. Overall, the confluence of the bearish order block (marked in red) and the psychological $300-resistance level meant that BNB could face rejection and a move lower on the price charts.
Binance Coin found steady demand at the $261-level and also faced strong sellers near the $300-mark. Since September, these two areas have been quite important. At the time of writing, the RSI had climbed past the 60-mark to show strong bullish momentum.
And yet, the OBV did not share a similar spike. This, because buying volume has been low. In fact, the OBV has been on a downtrend from August to signify a lack of demand.
Taken together, the OBV and the resistance zone suggested that BNB could retrace all its gains since mid-September.
Lowered social dominance, but will it reverse going into October?
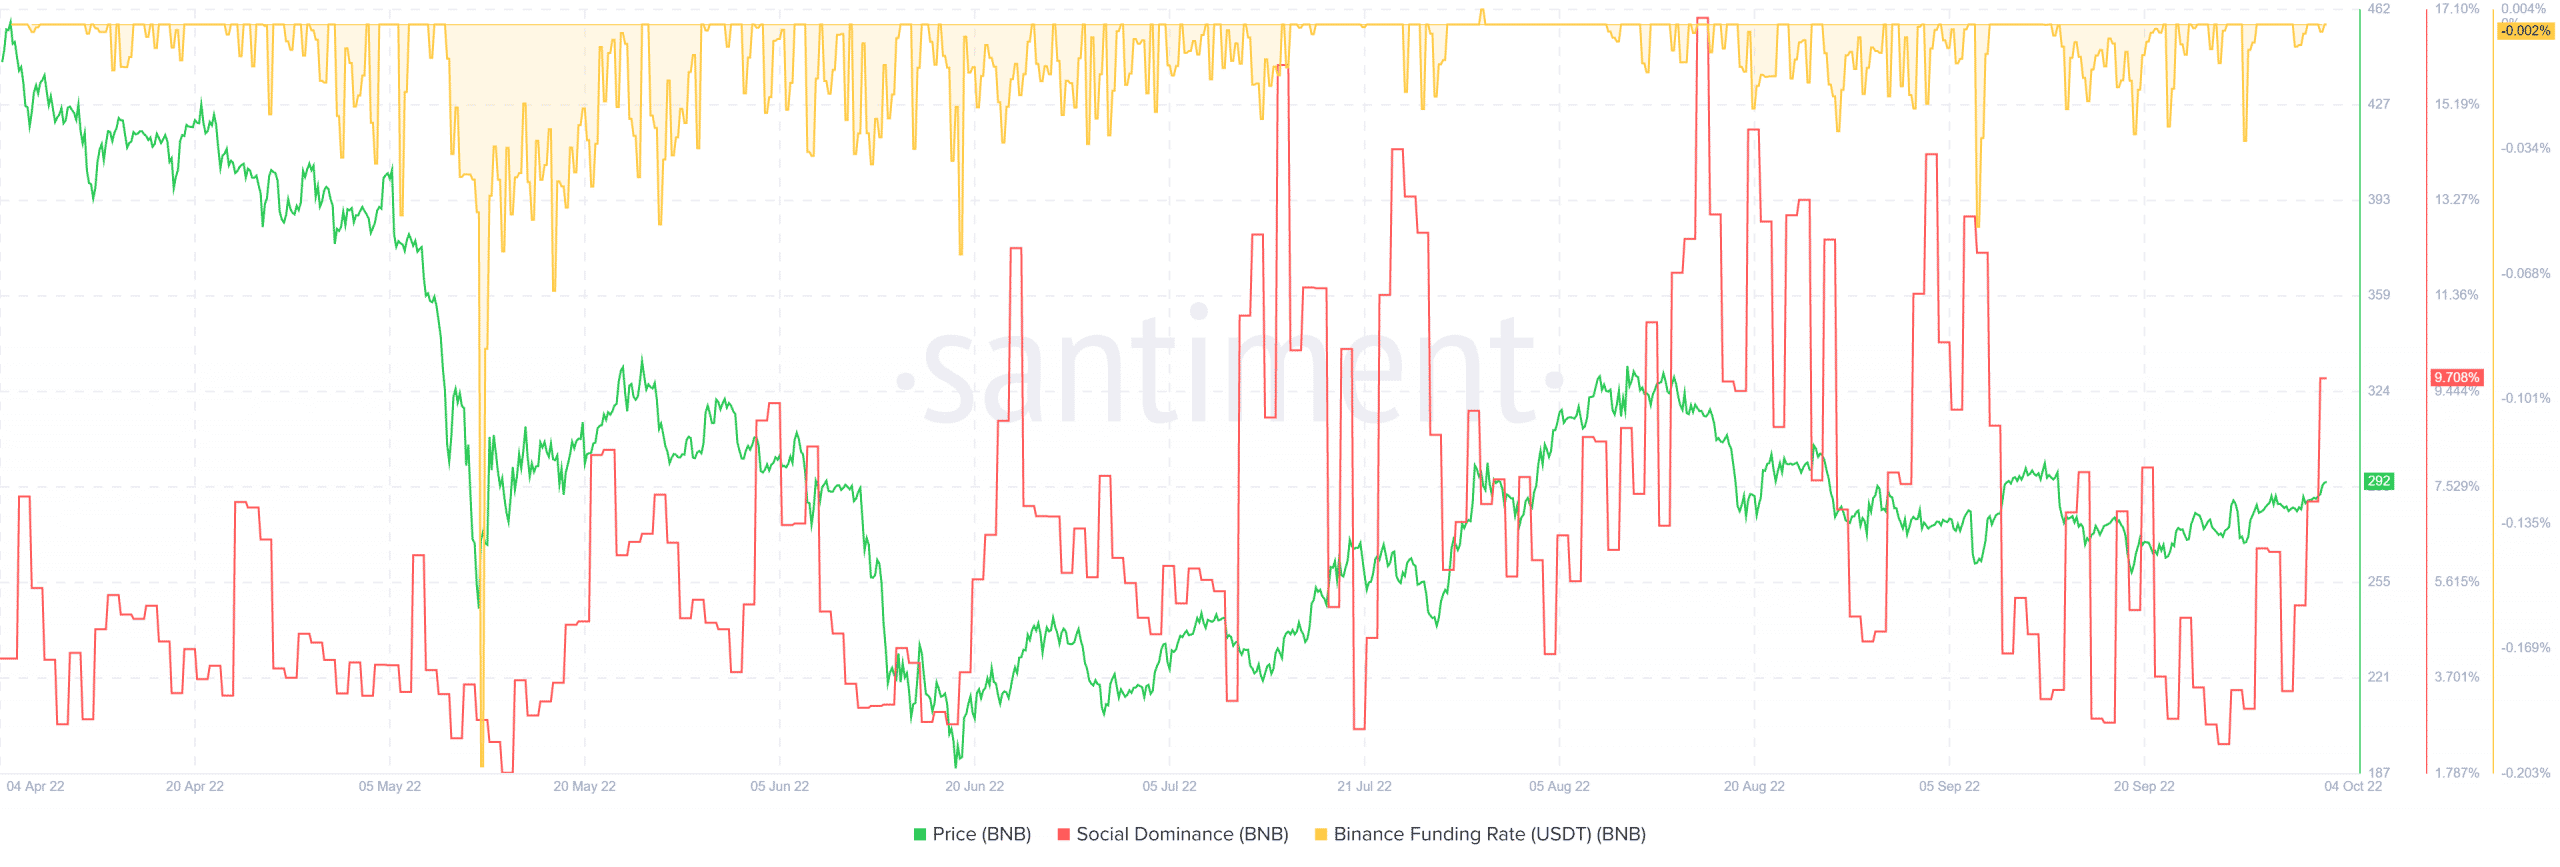
In mid-August, the Social Dominance metric of Binance Coin touched a six-month high at 17.1%. Since then, the dominance metric has posted lower highs to highlight the declining number of mentions the coin has seen. This could take a turn as a sharp spike north was registered a couple of days ago.
The funding rate has been slightly negative since mid-September. The previous week saw a nearly flat funding rate as the Futures market shifted from bearish towards neutral. As far as a more short-term outlook is concerned, the bulls have the majority. Coinglass data revealed that the past 24 hours have had a slight skew toward longs rather than shorts.
A rejection near the $300-mark could see BNB dip to $260 and possibly as far as $240. $277 can also act as interim support. This bearish notion would be invalidated if a daily session can close above $305 for Binance Coin.


