Analyzing the best-case scenario for WAVES’ near-term price action

Disclaimer: The findings of the following analysis are the sole opinions of the writer and should not be considered investment advice.
As the buyers finally deny the bears an extended sell-off liberty at the $12.8 -support, WAVES flipped the month-long trendline resistance (white) to support. The altcoin’s recent gains were in contrast to the market’s trajectory over the last day.
While the current buying rally moved WAVES above its 20 EMA (red) and 50 EMA (cyan), a well-founded close above the $14.3-level would open doorways for further recovery. At press time, the alt traded at $14.3787, up by 10.72% in the last 24 hours.
WAVES 4-hour Chart
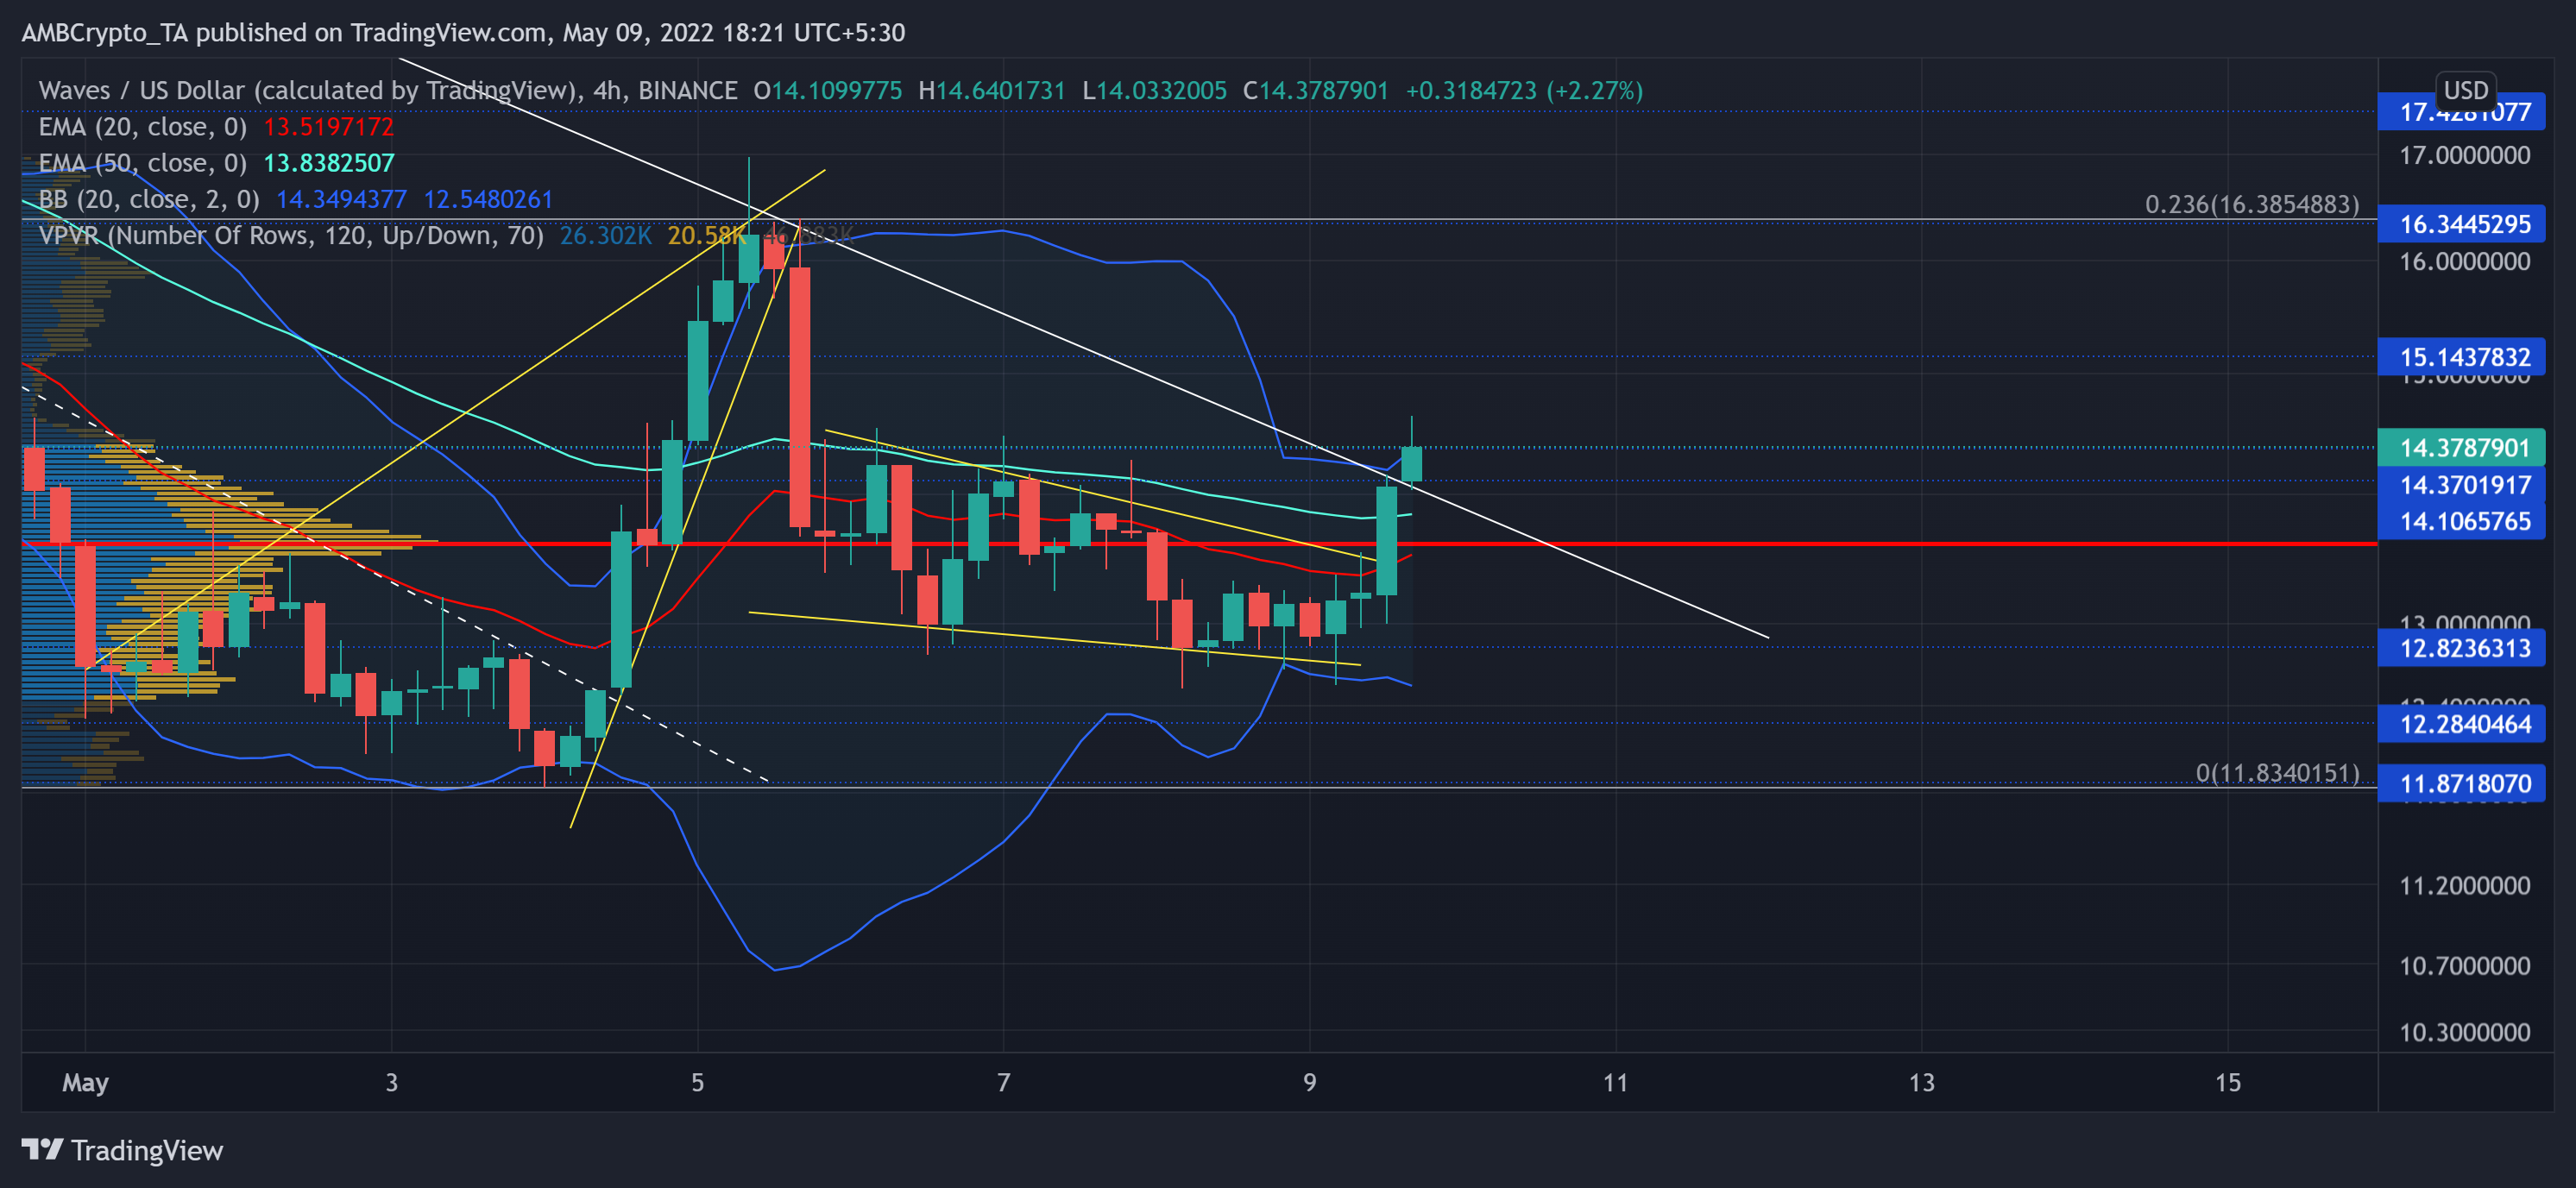
WAVES sailed south since the inception of April while puncturing through its Point of Control (POC, red). It lost over 81% of its value from the 31 march ATH and swooped toward its multi-week low on 4 May.
As the $11-$12 range reignited some buying pressure, the bulls finally snapped the month-long trendline resistance and turned it to support. Meanwhile, buyers propelled WAVES above the 20 EMA, 50 EMA, and the POC after the gains in the last 24 hours. Consequently, the upper band of the Bollinger Bands (BB) looked north and eyed to break out of the low volatility phase.
Now that the alt has jumped above the POC, any sustained close above the $14.3-mark could expose WAVES to test the $15-$16 range. The high volatility phase could bag in some well-needed gains before the sellers step in to initiate a correction. Should the buying vigor wane, potential reversals could find testing grounds at the immediate trendline support near the POC.
Rationale
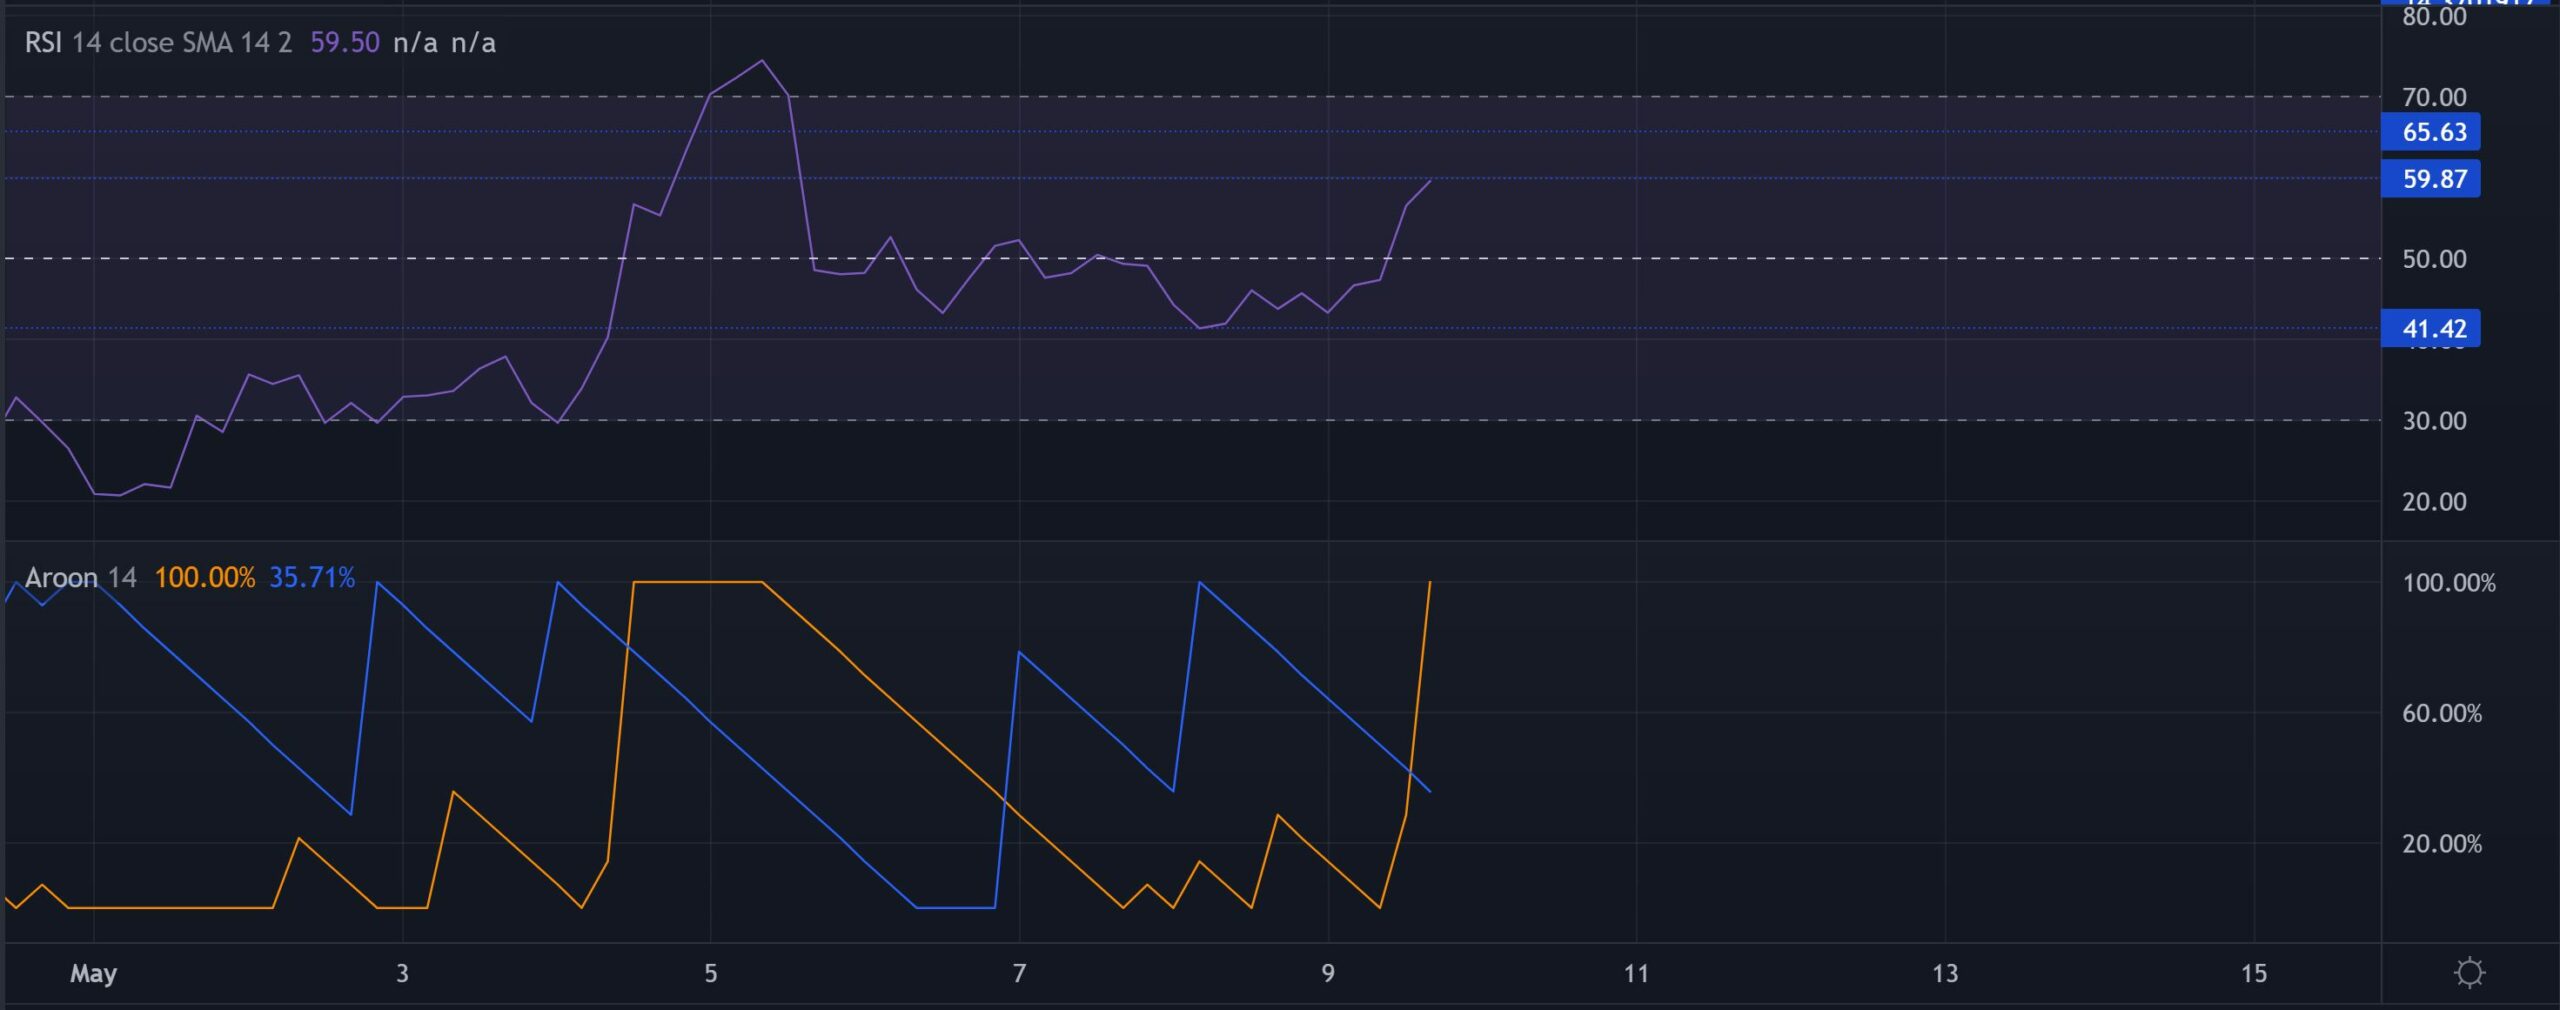
The Relative Strength Index pointed north after picking itself up from the 41-mark low. A move into the 59-65 range would indicate a further increase in buying power. In which case, toppling the $15-resisatance would be realistic for the bulls.
The Aroon up (yellow) approached 100% and visibly depicted a buying edge in the WAVES market. The investors should watch for a potential reversal from this level in the coming sessions to accurately identify the exit levels.
Conclusion
Defying the broader market, WAVES depicted a spike in its buying force over the past day. A sustained rally close above the $14.3 would affirm the chances of an extended recovery phase. In this case, the potential targets for the bulls rested in the $15-$16 range.
On the flip side, an immediate correction could see a fall toward the POC before a trend committal move by the market players. Nevertheless, investors/traders must keep a close watch on Bitcoin’s movement affecting the overall perception of the market.