As MATIC bounces back to an area of supply, will it be able to break out of it

Disclaimer: The findings of the following analysis are the sole opinions of the writer and should not be considered investment advice
Polygon reached new milestones as reports came in of the blockchain recording more than a billion transactions last year. The number of teams developing their projects on the network has also massively climbed in the past six months. This was great news for the network on a longer-term outlook. In the near term, the native token MATIC was approaching an area of resistance at $1.8. Will it climb past this area and flip it to support, or will bears impose their will on the market once again?
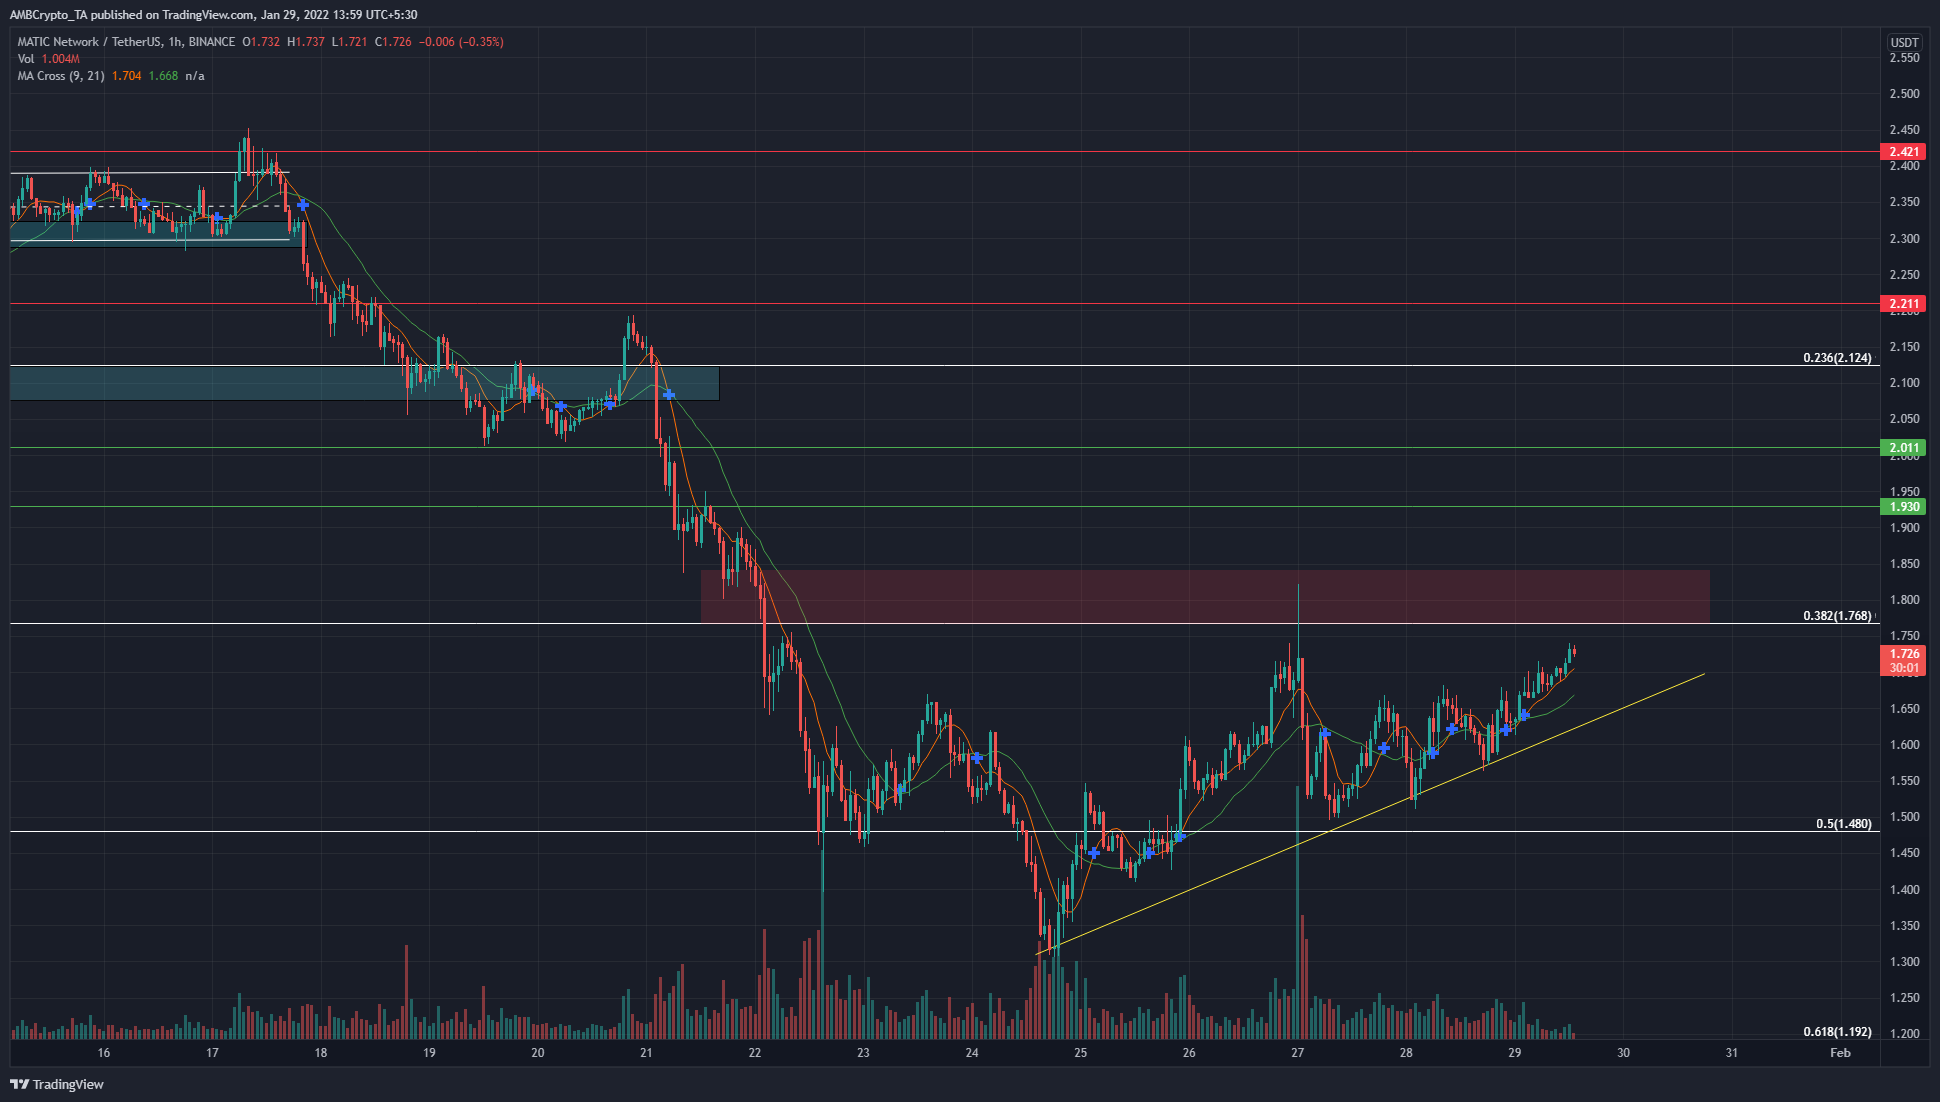
Over the past few days, the price found demand at $1.34 and has bounced considerably from that level. It was a level that MATIC last traded at in October 2021. The steady gains of the past few days represented some short-term bullishness, but in the wider context of the market, it was likely only some respite before further downside.
On higher timeframes, the market structure continued to be bearish. A move past $1.8 and flipping it to an area of demand would be necessary to ignite the idea of a bullish trend.
Bitcoin could climb past $38.5k and as far as $42k, but these levels represent areas where demand was once strong but has since been exhausted. A retest would likely be rejected and not an indication of a new uptrend. In a similar way, MATIC also has an area of significance in the $1.8 area (red box), a place where sellers could step in.
It could climb to $1.85 before seeing another leg downward.
Rationale
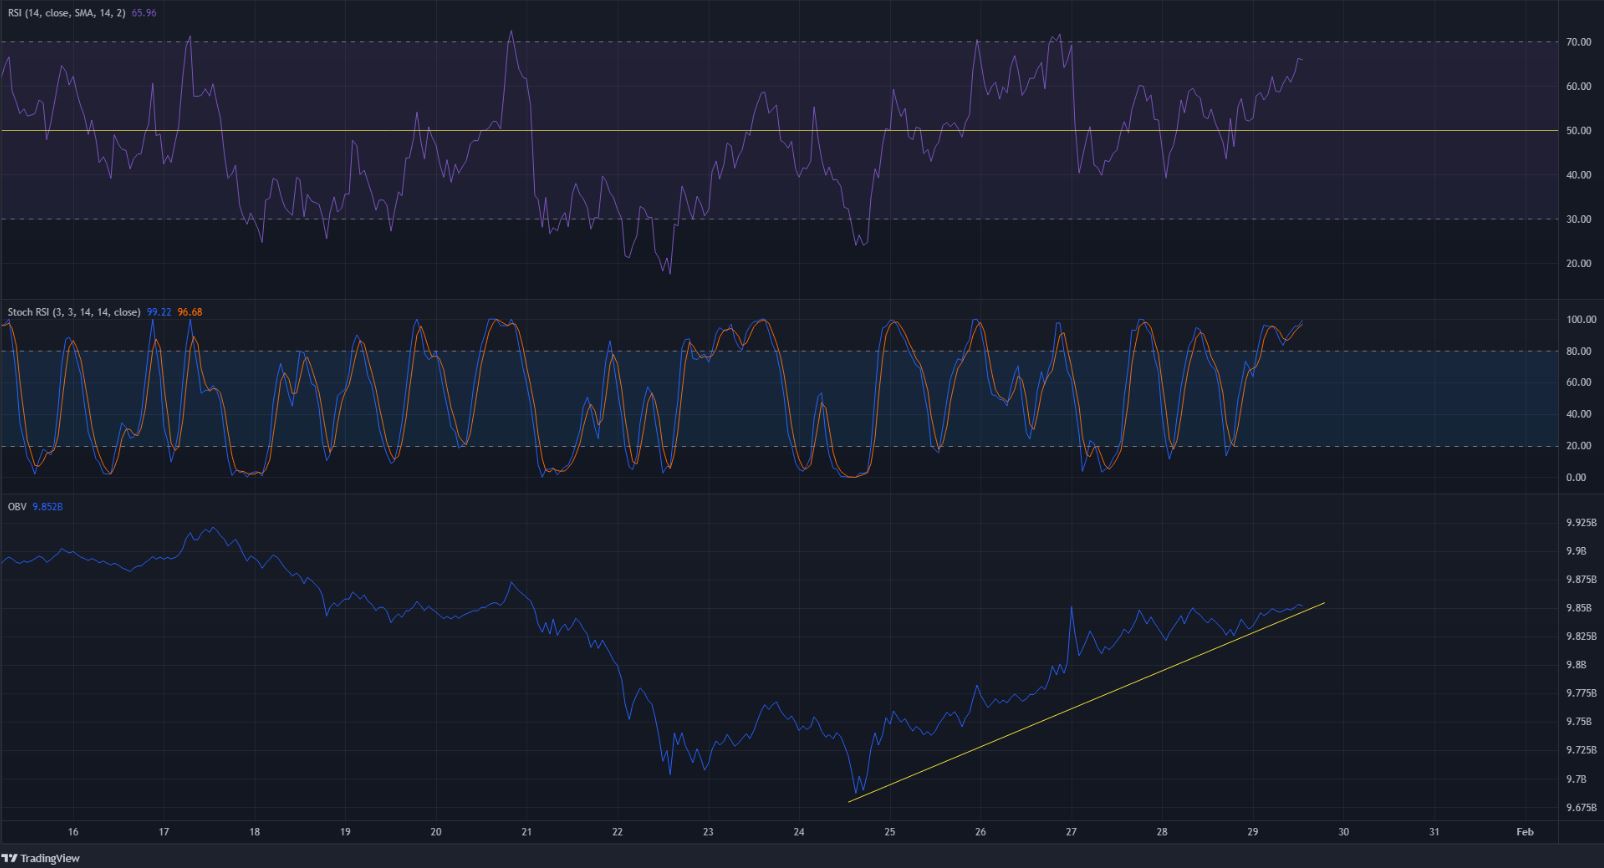
The RSI has been above neutral 50 in the past couple of days, which suggested some near-term bullish momentum was indeed present. A bearish divergence had not yet developed, and such a development could be an early signal of a deep pullback. The Stochastic RSI was in the overbought territory.
In agreement with the trend of the past few days, the OBV has also been climbing, a sign of buying pressure.
Conclusion
In terms of risk-to-reward, MATIC was not trading at an area where buying the asset was feasible over the next few days. A selling opportunity could arise at $1.8-$1.85, or even as high as the $2 level.


