
- TRX registered a decline in volume and development activity over the past week
- However, its daily chart showed signs of revival as the alt registered over 2% weekly gains
TRON [TRX] recently posted its weekly highlights, which encapsulated all the developments that took place in its ecosystem over the past seven days.
Notably, the number 74 voting request passed the vote on TRON and the blockchain became a sponsor for Consensus 2023, a prominent festival of the crypto industry.
?Check out #TRON Highlights from this week (Nov 19, 2022 – Nov 25, 2022).
?We'll update you on the main news about #TRON and #TRON #Ecosystem. So stay tuned, #TRONICS! pic.twitter.com/KX1BTAJori
— TRON DAO (@trondao) November 26, 2022
Justin Sun, the founder of TRON and global advisory board member of Huobi, attended the Huobi rebranding launch event. During his appearance, he mentioned that a global public chain ecosystem will be built by integrating TRON, HECO, and BTTC’s cross-chain technology.
All these developments looked promising for the TRON ecosystem and indicated that the blockchain had an optimistic future. However, these updates had little effect on TRX’s chart.
As per CoinMarketCap, TRX only increased its price by 2% over the last seven days. At the time of writing, it was trading at $0.05332 with a market capitalization of more than $4.9 billion.
Metrics did not correspond
Not just the price action, but TRON’s on-chain metrics also did not respond to these developments. For instance, TRX’s volume went down over the last week despite the slight increase in its price, which was a negative signal for the token holders who were willing to go long.
TRX’s development activity also followed a similar route and registered a decline on 24 November, after which it took a sideways path.
Nonetheless, TRX received interest from the derivatives market as its Binance funding rate registered an uptick.
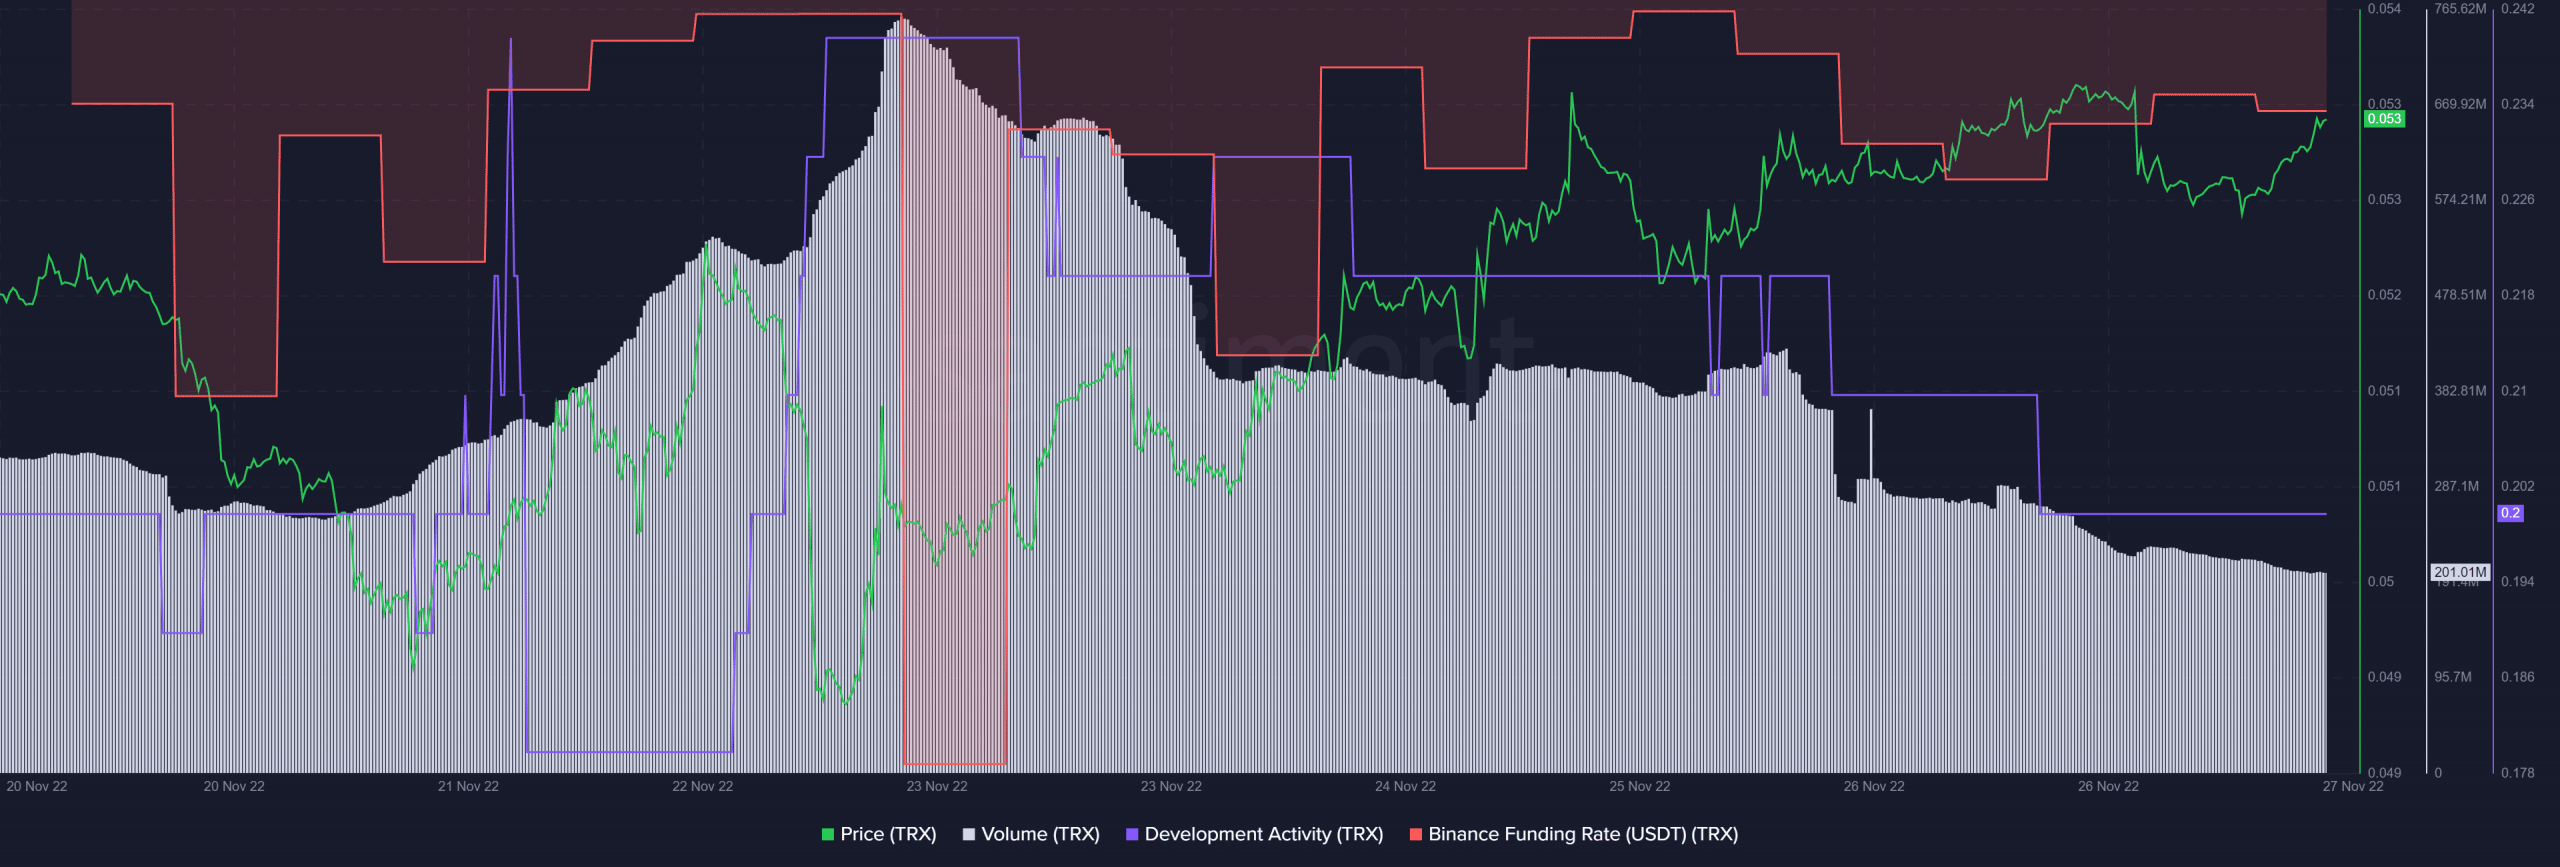
Source: Santiment
Interestingly, TRON’s NFT space witnessed a decline over the past week. Santiment’s data revealed that TRON’s total NFT trade count and total NFT trade volume in USD, after going north, went down in the last few days.
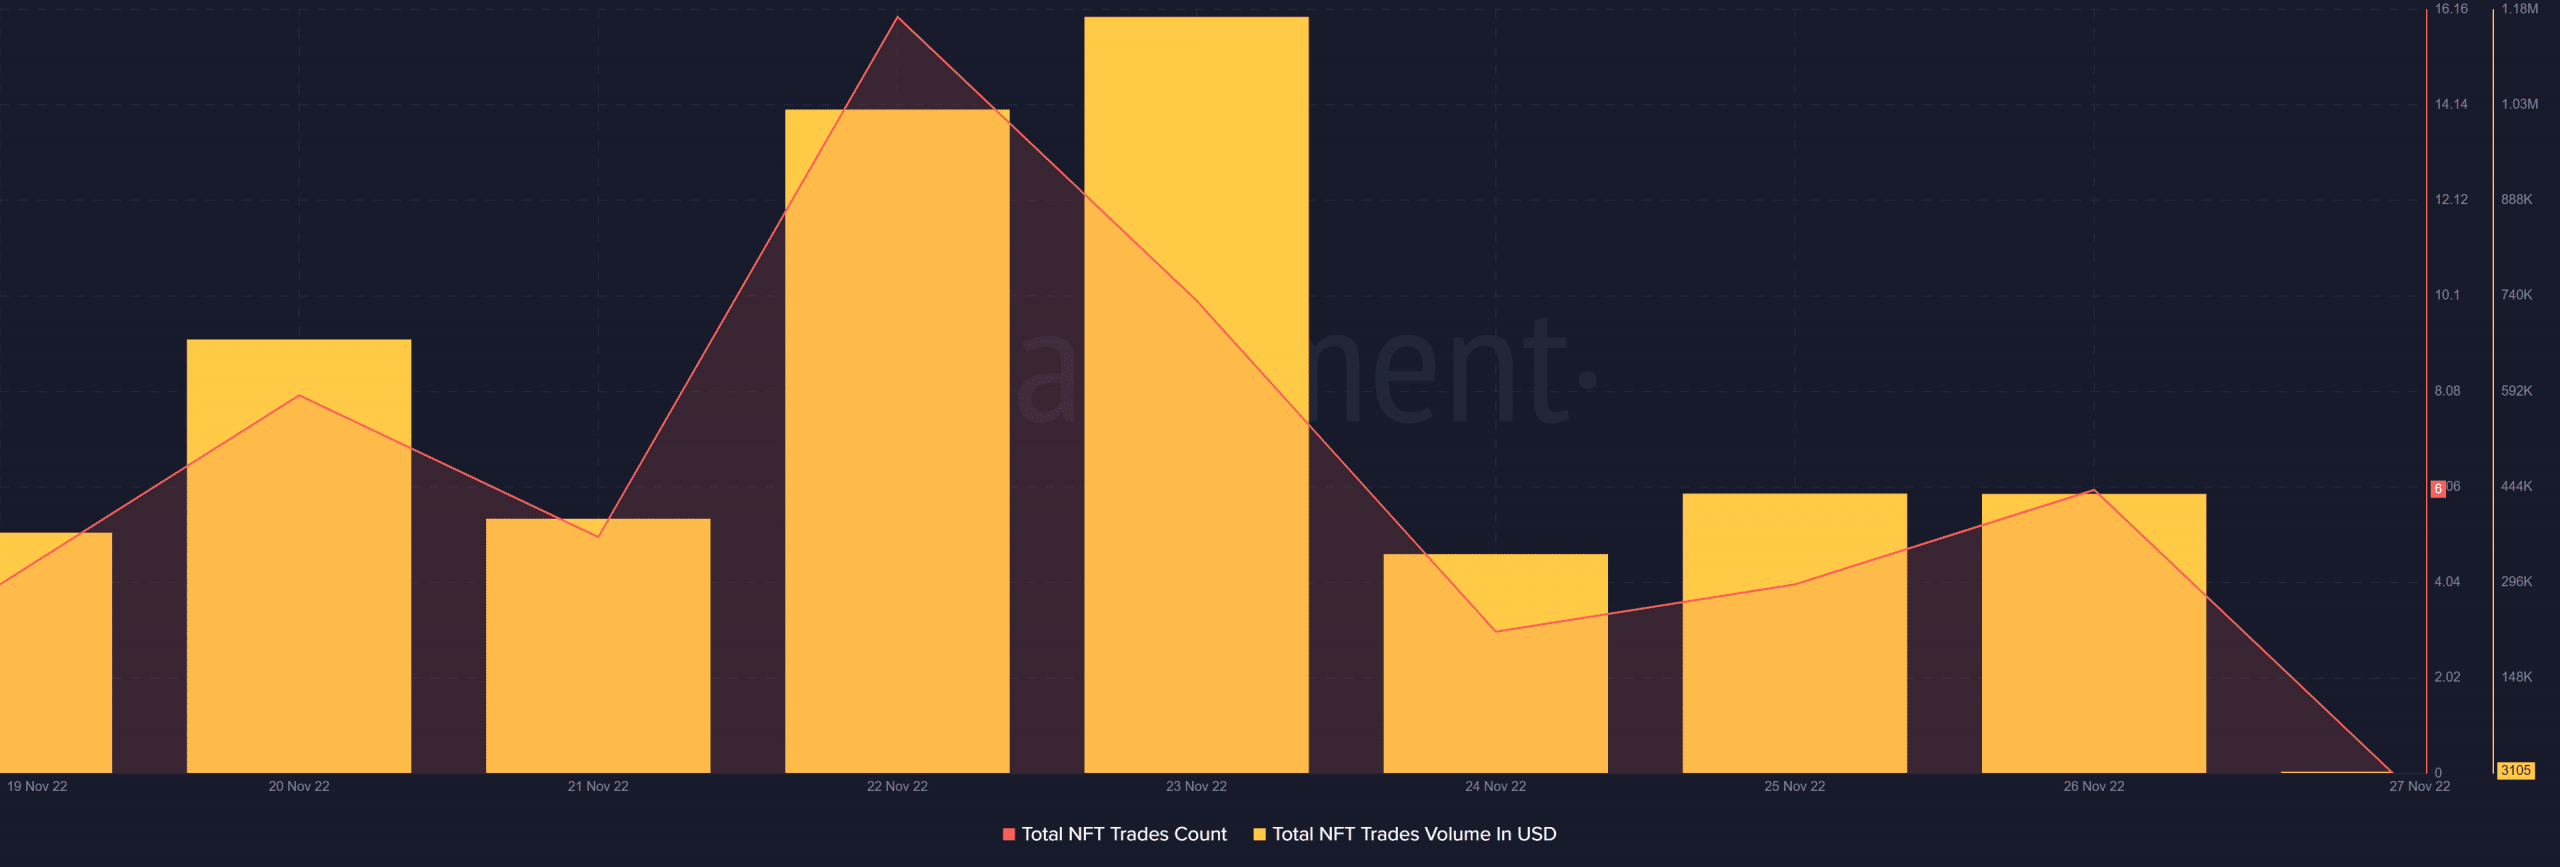
Source: Santiment
TRON did hit some positive notes, though
However, a look at TRX’s daily chart revealed some wonderful insights for the long-term holders. TRX’s Relative Strength Index (RSI) and Chaikin Money Flow (CMF), after registering declines, went up during the last days of the week.
Furthermore, TRX’s MACD also displayed a bullish crossover, suggesting that good days might be ahead for TRON investors.
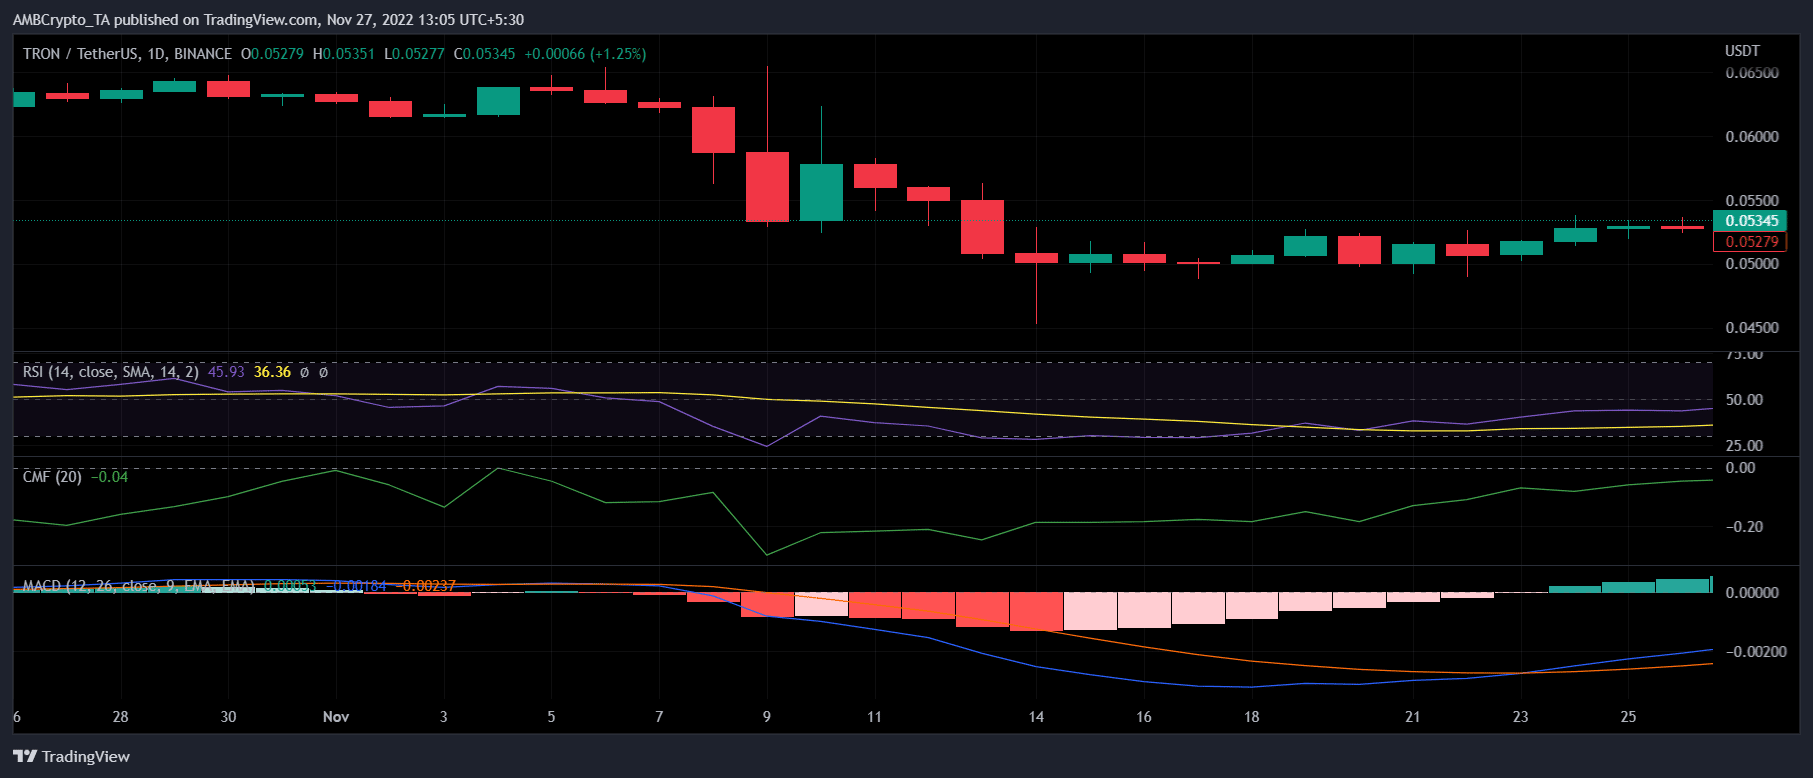
Source: TradingView