Binance Coin, Chainlink, Solana Price Analysis: 29 June

Trading volumes for Binance Coin, LINK, and SOL have risen significantly over the last 24 hours. Curiously, despite the UK’s FCA issuing a warning to Binance, its native token didn’t react too negatively to the same. Finally, Solana recently made headlines when Digital Assets AG announced the operation of tokenized stocks on the Solana blockchain.
Binance Coin [BNB]
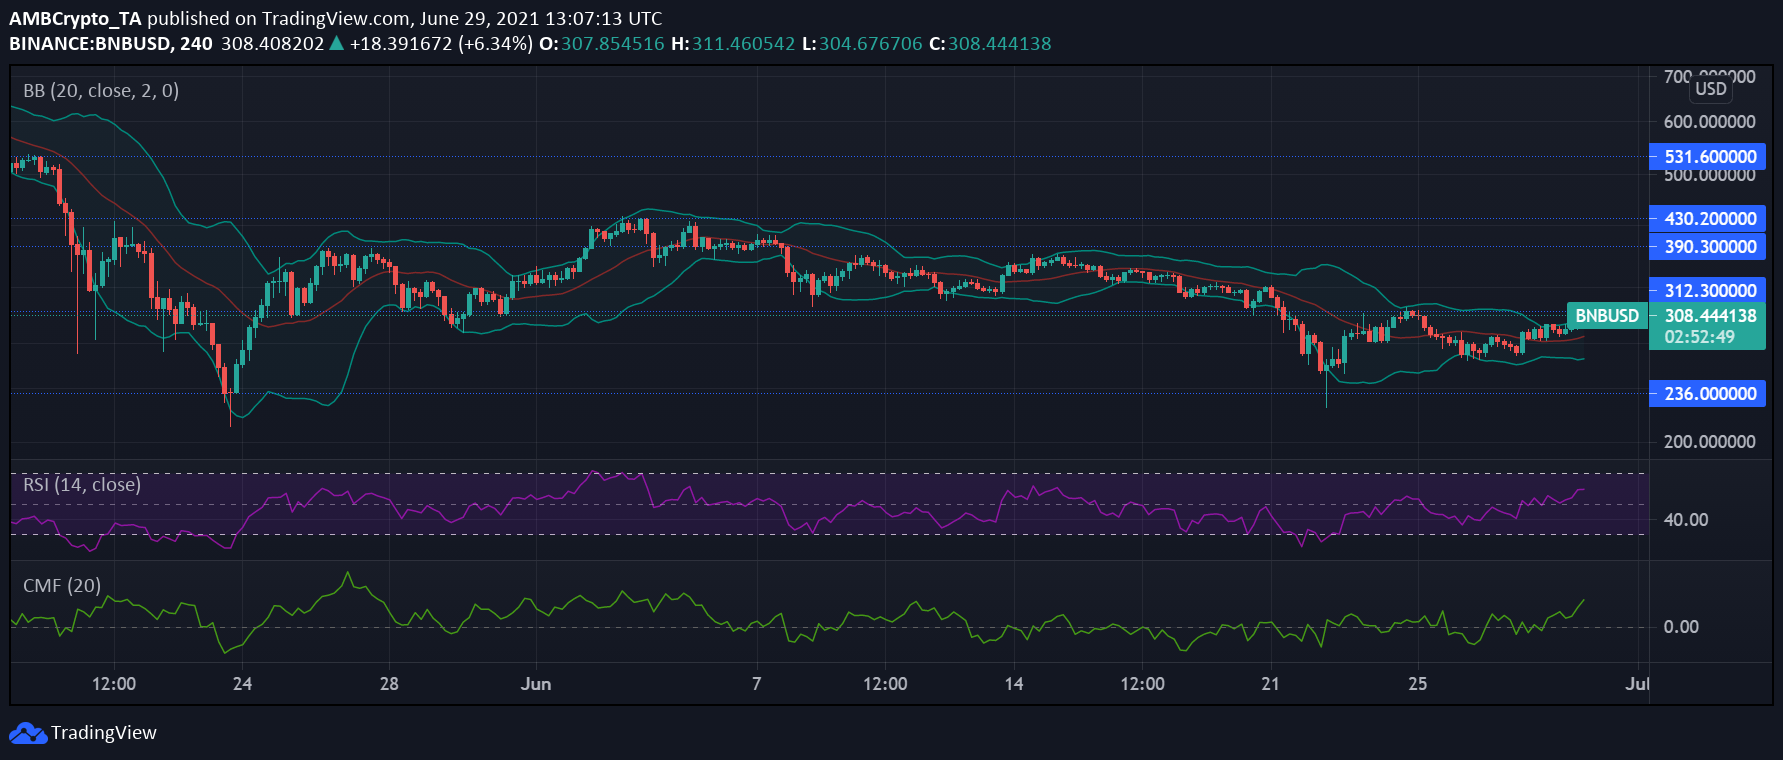
Amidst the FCA’s warning to crypto-exchange Binance, its native token held on to its northbound momentum at press time. On the 4-hour trading chart, the altcoin noted some price corrections, despite the same hiking by 7.1% over the last 24 hours. Overall, Binance Coin registered a steady week of trading on the charts.
The Relative Strength Index was heading towards the overbought zone, a sign of the buy-out signal building up. Capital inflows were on the rise as well, as pictured by the Chaikin Money Flow.
The Bollinger Bands for the asset were holding steady, with the same highlighting the likelihood of price stability in the near term.
Binance Coin’s market capitalization increased by 5.57% in the last 24 hours, with its trading volume hiking by 20% too.
Chainlink [LINK]
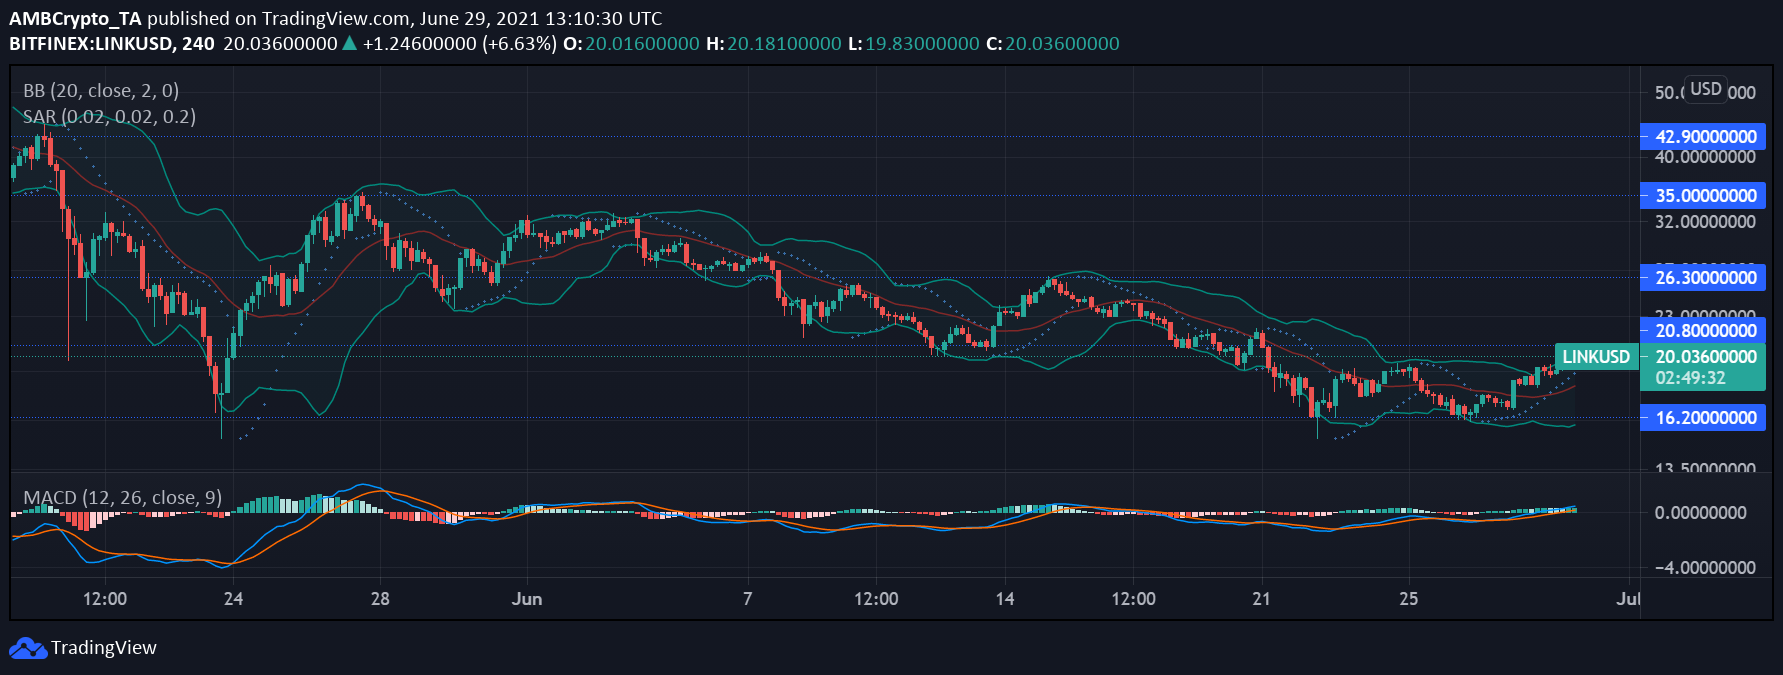
The 4-hour trading chart for LINK pictured an upward trend, with the coin closing above its resistance level of $20 just a day back. Following a further surge in price, the next resistance level to look forward to would be $26. The attached chart confirmed the altcoin’s bullish outlook.
The MACD indicator pictured a bullish crossover on 27 June and since then, the alt has moved on with bullish momentum. This finding corresponded with the Parabolic SAR’s dotted markers being found below the candlesticks.
Finally, the Bollinger Bands depicted an expanded price range for the alt to move within as the bands diverged.
Solana [SOL]
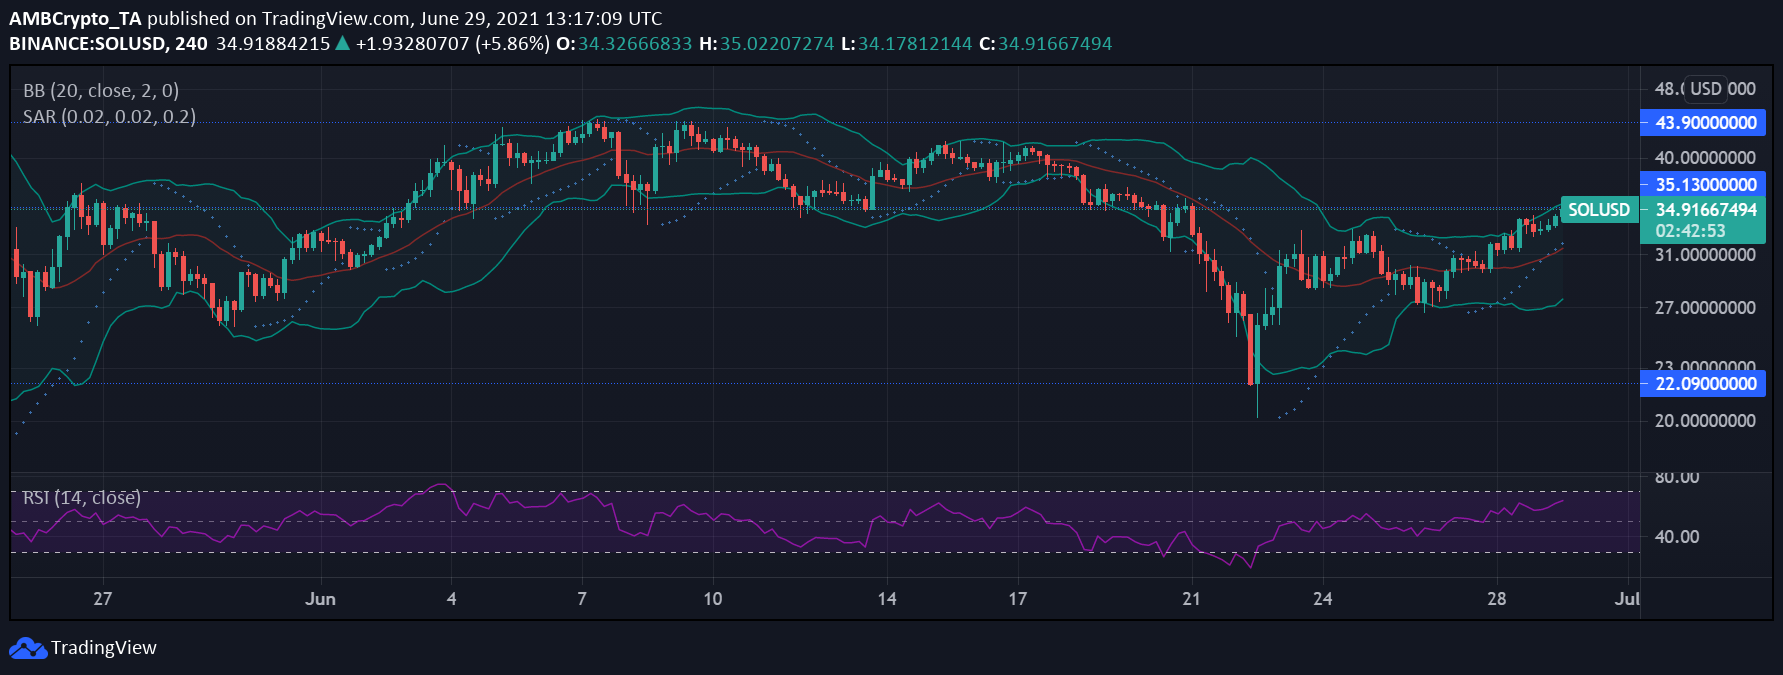
Solana was comfortably trading uphill at press time, with the alt up by 12.3% to trade over the past 24 hours. SOL showed noticeable signs of price recovery caused by the overall market weakness over the last few weeks. What’s more, the asset noted a hike in buying pressure, as pictured by the Relative Strength Index.
As the bulls could potentially take over the market, the Parabolic SAR affirmed the same by picturing an uptrend. In case of a further hike in prices, the crypto could find resistance at $41.
Finally, the Bollinger Bands highlighted a degree of upward movement, with some divergence in the same pointing to more volatility over the next few trading sessions.


