Binance Coin, Dogecoin, Litecoin Price Analysis: 20 June

At the time of writing, Bitcoin had fallen 3.9% in just the past hour, reaching $33,700 before making a reversal and trading at $34,000. This was reflected in correlated Dogecoin and Litecoin, which registered notable losses over the past day and traded in the red. DOGE and LTC continued to move in a downward trend after breaching support levels on 18 June. However, Binance Coin showed signs of recovery with stable market volatility.
Binance Coin [BNB] –
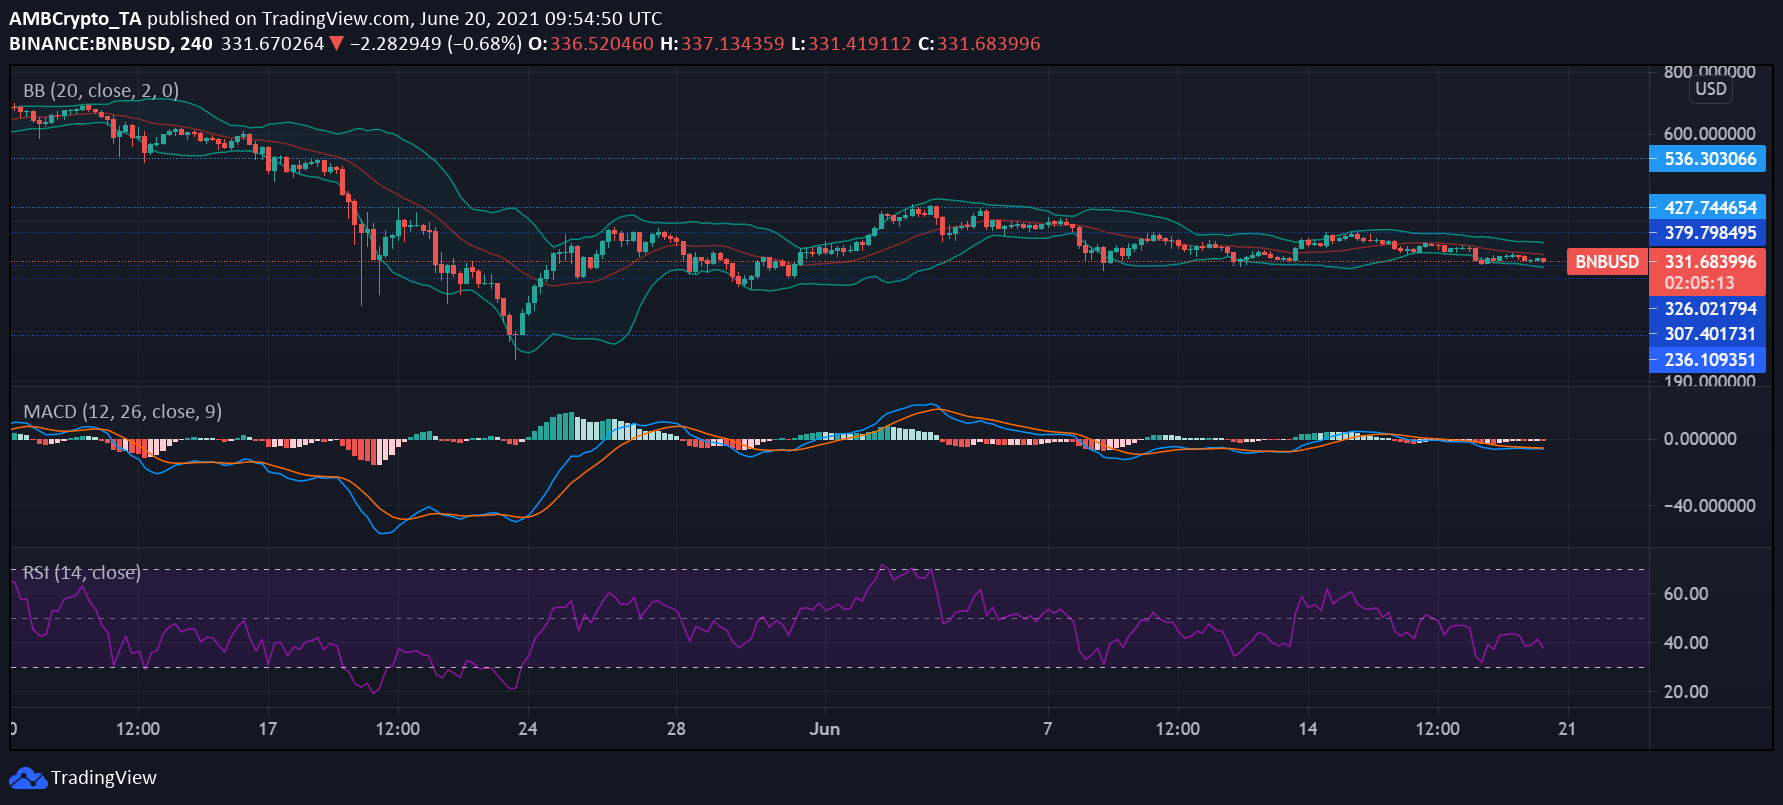
Trading at $333 at press time, Binance Coin had a 1-day price drop of 2.5% and a 7-day price drop of 3.1. Since the 17% fall on 7 June, BNB traded within its close channel, testing support at $326 on 18 June. While it traded close to its strong support, the key resistance lay at $380. The altcoin was ranked 4th with a market dominance of 3.48%.
Bollinger Bands for the asset were parallel, highlighting stable volatility and price range. Further, MACD lines closed in on a bullish crossover while moving in close proximity.
Relative Strength Index or RSI noted a reading of 38.5 at the time of writing, after bouncing back just above the oversold region. Selling pressure continued to dominate as RSI stayed below the median line and moved in a downward direction.
Dogecoin [DOGE] –

DOGE’s steady price decline in June remained evident, as it fell 37% from its June 2 high of $0.44. Trading at $0.27, the coin had dropped 10% just over the past two days and was testing its resistance at the same mark at the time of writing. It was down 61.53% from its ATH in May, while its monthly ROI was down by 13.24%.
After a brief reversal, the memecoin again entered the oversold region last night. The drop in prices caused mounting selling pressure, although it could lead to a reset going forward. Awesome Oscillator indicated that bearish momentum had taken over again after a day of a slight recovery.
Parabolic SAR’s dotted line had been hovering above the candlesticks since June 12, highlighting the continued bearish trend the coin’s price movement had been following over the past week.
If the downtrend continues, the asset could fall to its late April price of $0.22.
Litecoin [LTC] –

Litecoin breached the $157 resistance on 18 June and lost 9.7% of its valuation over the past week. Trading at $148 at press time, LTC was defending resistance mark at $144.5. LTC’s market cap was at $9.8 billion, falling 6.65% over the past day.
Bollinger Bands pictured divergence at the time of writing and rising market volatility could cause sharp price action going forward.
Chaikin Money Flow remained in the bearish territory, pointing south as capital outflows continued to precede inflows. MACD lines remained in a bearish crossover the occurred on 16 June, as the price has steadily fallen over this time, even as they moved close to each other.
Sharp price action in the downward direction could be expected for the coin, in which case it will find support at $130.


