Binance Coin: Why traders should prepare for this move

The crypto industry was left rattled by a recent tweet published by Poly Network which identified a $600 Million theft from its system. The decentralized finance platform, which functions on the Binance Smart Chain, Ethereum and Polygon, later added that the amount of money hacked is one of the biggest in DeFi history.
While the crypto community flocked in to condemn the attack, BNB’s value on the charts remained unhinged by the distressing news. In fact, the alt rallied alongside its competitors and even closed above a key resistance. At the time of writing, BNB traded at $388.2, up by 10% over the last 24 hours.
BNB 4-hour Chart
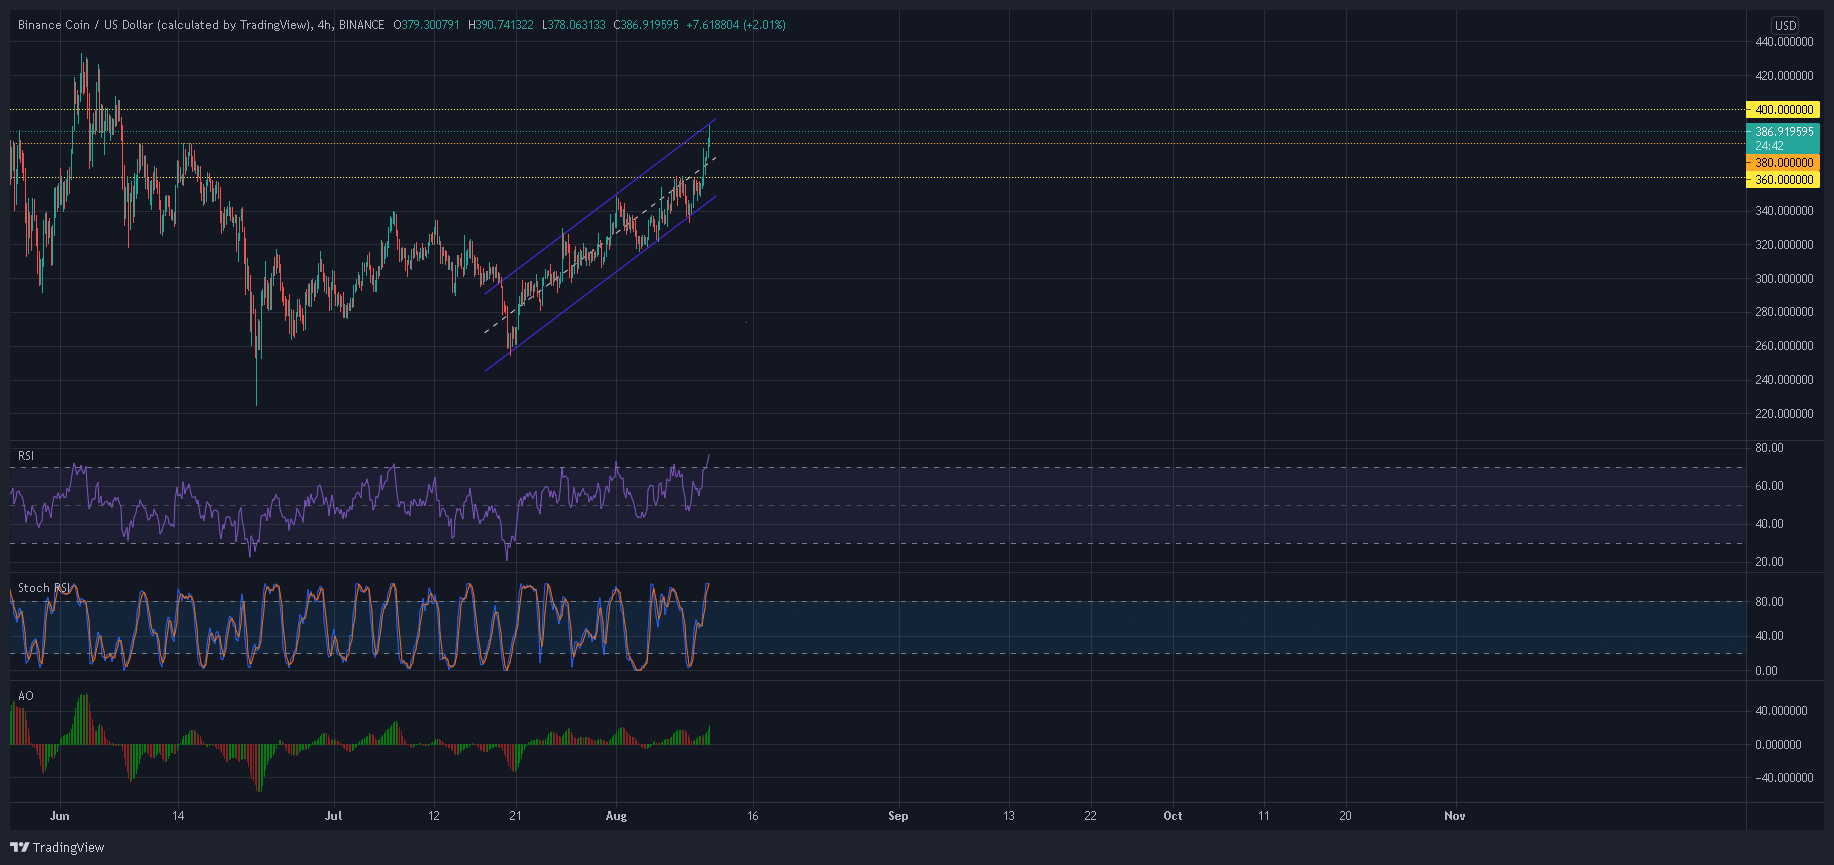
Since late-July, BNB formed higher highs and higher lows and climbed steadily on the charts. An upper and lower trendline were plotted on its 4-hour chart which created an ascending channel.
The recent jump also allowed prices to rise above $380- a region that initially capped BNB’s gains in early June. Now that BNB traded above this ceiling, its next target lay at its 3rd June swing high of $430 which seemed to be the last bastion of defense for a sharper price hike.
However, there were multiple warning signs in the market. For instance, BNB traded at the upper trendline- an area where traders usually exit their positions as per the pattern. Secondly, the price traded close to its weekly 20-SMA (not shown) which moved bearish. If these factors come into play, BNB could gear for a 8.5% decline towards its 20-SMA (red) and $360-support. A fall below this level would leave BNB vulnerable to an extended sell-off.
Reasoning
The Relative Strength Index peaked in the overbought zone on the daily, 4-hour and hourly charts. These conditions usually act as a sell-signal before the next leg upwards. The more price sensitive Stochastic RSI was already on the cusp of a bearish crossover. On the other hand, the Awesome Oscillator formed a higher peak and traded at its highest level in over a month. A bullish outcome would be validated in case of a close above the $400-mark.
Conclusion
Since BNB traded at the upper trendline of its up-channel, the alt was expected to experience some selling pressure. RSI peaked on three timeframes and called for stabilization. To negate such a thesis, bulls would need to target a rise above the psychological $400-mark.