Bitcoin: Are the quick gains a ‘dead cat bounce’ or a path to $100,000
Bitcoin made a grand entry in the fourth quarter retesting the $48K mark as “Uptober” began. As the top coin gained around 18% in less than a week the crypto-market sent out a strong-trend signal. While the gains paved way for improving on-chain metrics, the broader market saw re-gained momentum.
At the time of writing, Bitcoin’s price jumped more than 10% in the last two days as the coin traded at $47.7K. However, with BTC’s price facing strong resistance at $48.5K, many in the market suspected the sudden price growth to be a “dead cat bounce,” giving wings to bearish theories for the top coin.
Recovery or a dead cat bounce?
A dead cat bounce in finance, is used to describe a short-lived recovery from a prolonged decline. It always pops up in the form of a small rally after a continued downward trend in prices. At first, the price bounce appears to be a reversal of the prevailing trend, but it’s quickly followed by a continuation of the downward price move.
In the case of Bitcoin, the dead cat bounce theory resurfaced after BTC’s quick recovery from the September losses took place on the first day of October.
Interestingly according to a CryptoQuant post, BTC has seen many a dead cat bounces in the past. A closer look at BTC’s netflows over the past cycles has revealed that such price bounces have historically seen a certain pattern.
BTC’s Exchange ‘Netflow’ assesses the difference between inflows and outflows taking place for the coin. The value is negative when outflows dominate and vice versa. In that context, continued negative values imply buying pressure and are generally bullish for the price.
However, highly positive Exchange Netflow values are followed by or coincide with the formation of the dead cat bounce. The trend has been noted in 2017, 2018 and then in 2019 when inflows dominated BTC’s chart.
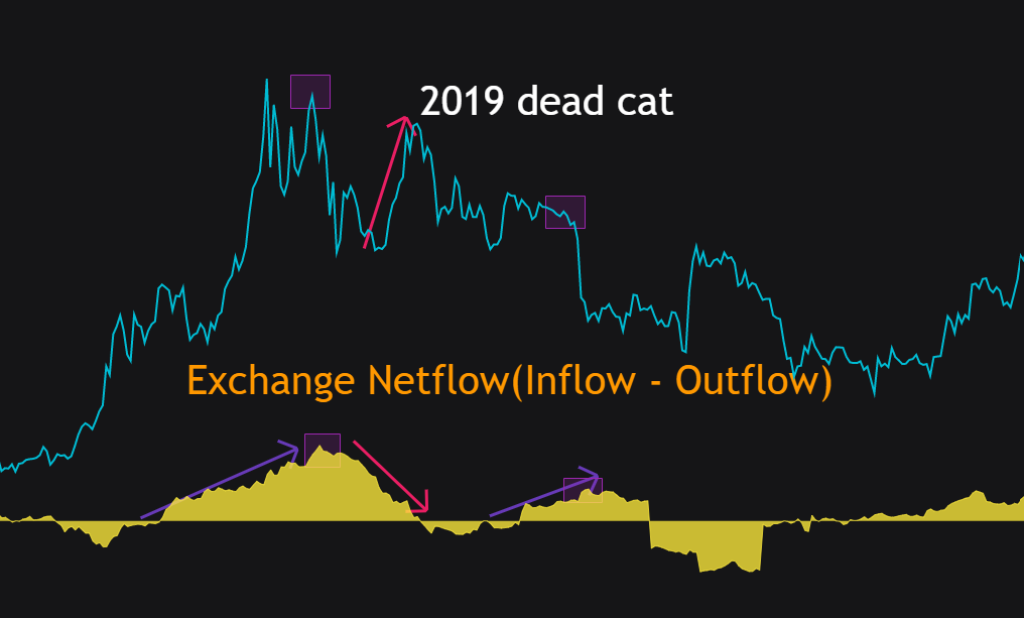
This year too, the peak that formed after the May ATH was in fact a dead cat bounce as confirmed by highly positive netflow values. However, this time net flows were severely negative and the trend looked similar to the 2017 cycle when outflows dominated and negative net flows pumped the price. Thus, looks like the dead cat jump theory was failing to sustain, given the current negative net flows.
Metrics giving a healthy outlook
So, with outflows still dominating and Long-Term Holders absorbing more BTC with each cycle highlighting re-accumulation the supply-demand curve for BTC noted a bullish outlook. However, considerable skepticism around BTC’s price gains ahead of the $49K mark was noticeable in the low trade volumes seen both in the spot as well as the options market.

Nonetheless, a large number of long calls for BTC to $100K by October 2 were indicative of high long-term expectations from the top coin. Seemingly, with Bitcoin’s candles turning green, the environment looked favorable for the initial leg of Bitcoin’s rally to set in. Looks like the last quarter of this rather interesting year for BTC would be an interesting time for the market participants.


