Bitcoin: Assessing what this week will have in store for BTC
Bitcoin (BTC) just concluded another week underpinned by low volatility and a limited range on the price charts. Traders and investors waiting for the return of BTC volatility may still have some hope, however, courtesy of the following observation.
Here’s AMBCrypto’s price prediction for Bitcoin (BTC)
A recent CryptQuant observation by an analyst with the pseudonym theKriptolik pointed out a potentially bearish scenario. According to the analysis, Bitcoin reserves in the derivatives market are higher than spot reserves.
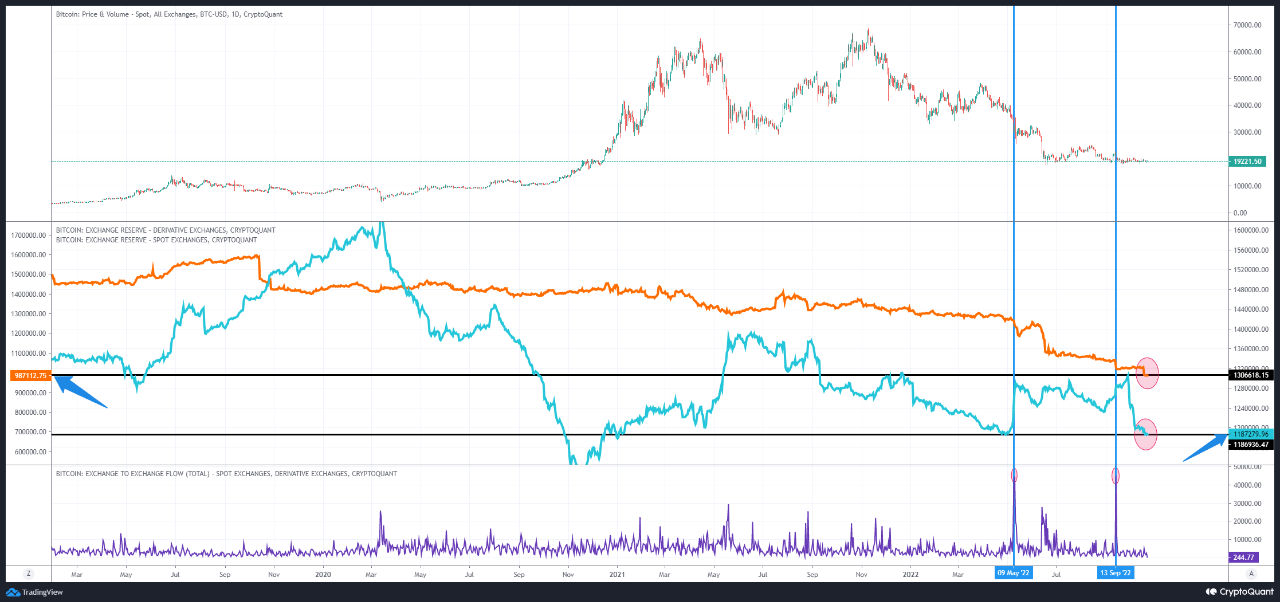
Higher demand in the derivatives market, compared to demand in the spot market, is commonplace in a bear market. It also underscores highly leveraged trades as traders attempt to boost their potential profits. However, this often leads to liquidations, especially in unfavourable market conditions.
Is Bitcoin at risk of more sell pressure?
Highly leveraged trades compared to spot activity does indicate potential risk of liquidations, especially if prices tank further. A look at Bitcoin’s ongoing price action seemed to suggest that such an outcome is highly probable.
If we zoom out and observe BTC’s price action since June, we observe that it has been trading within a wedge pattern. Even more interesting is that the same wedge pattern is currently squeezing the price within a tight zone. This may explain why the price has been trading within the narrow range for the last few weeks.

Bitcoin’s current position in the wedge pattern reveals that it will soon have to exit the pattern. Although there is a chance it might continue trading sideways, the chances of a breakout or breakdown are notably higher. This, because the same squeeze zone often brings up a psychological expectation that a large move is about to happen.
As far as on-chain metrics are concerned, BTC’s exchange whale ratio increased slightly over the last 3 days. This is important because this ratio tells us whether there is high or low whale activity on exchanges. A low ratio reveals low whale activity and vice versa. In this case, an increase in the exchange whale ratio confirms that some whale activity returned this week.
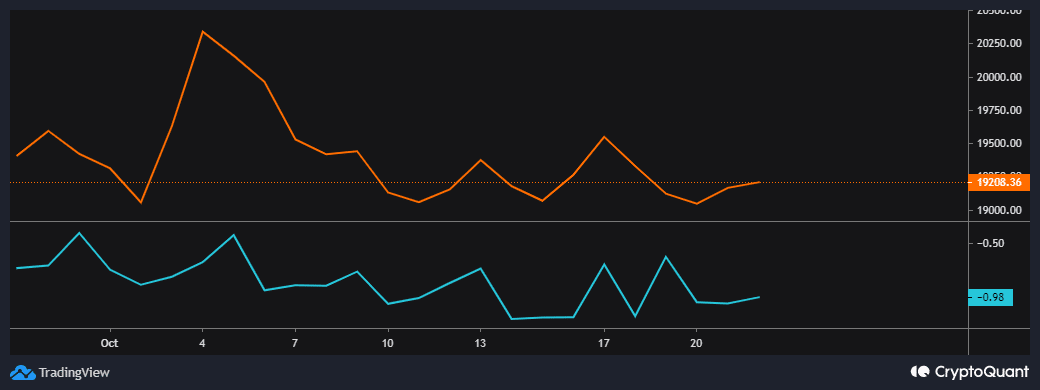
Now that some whale activity has returned, a bullish or bearish outcome will depend on whether they will be buying. Miners’ position index levelled out and registered a slight upside in the last 3 days. This means miners are sending coins and this could be an indicator of incoming sell pressure. The same indicator is still near its lower monthly range. Hence, it is not exactly an accurate representation.
Whale addresses balances are better suited to provide a visual representation of current demand. Addresses holding more than 100 BTC dropped significantly in the last 3 to 5 days.
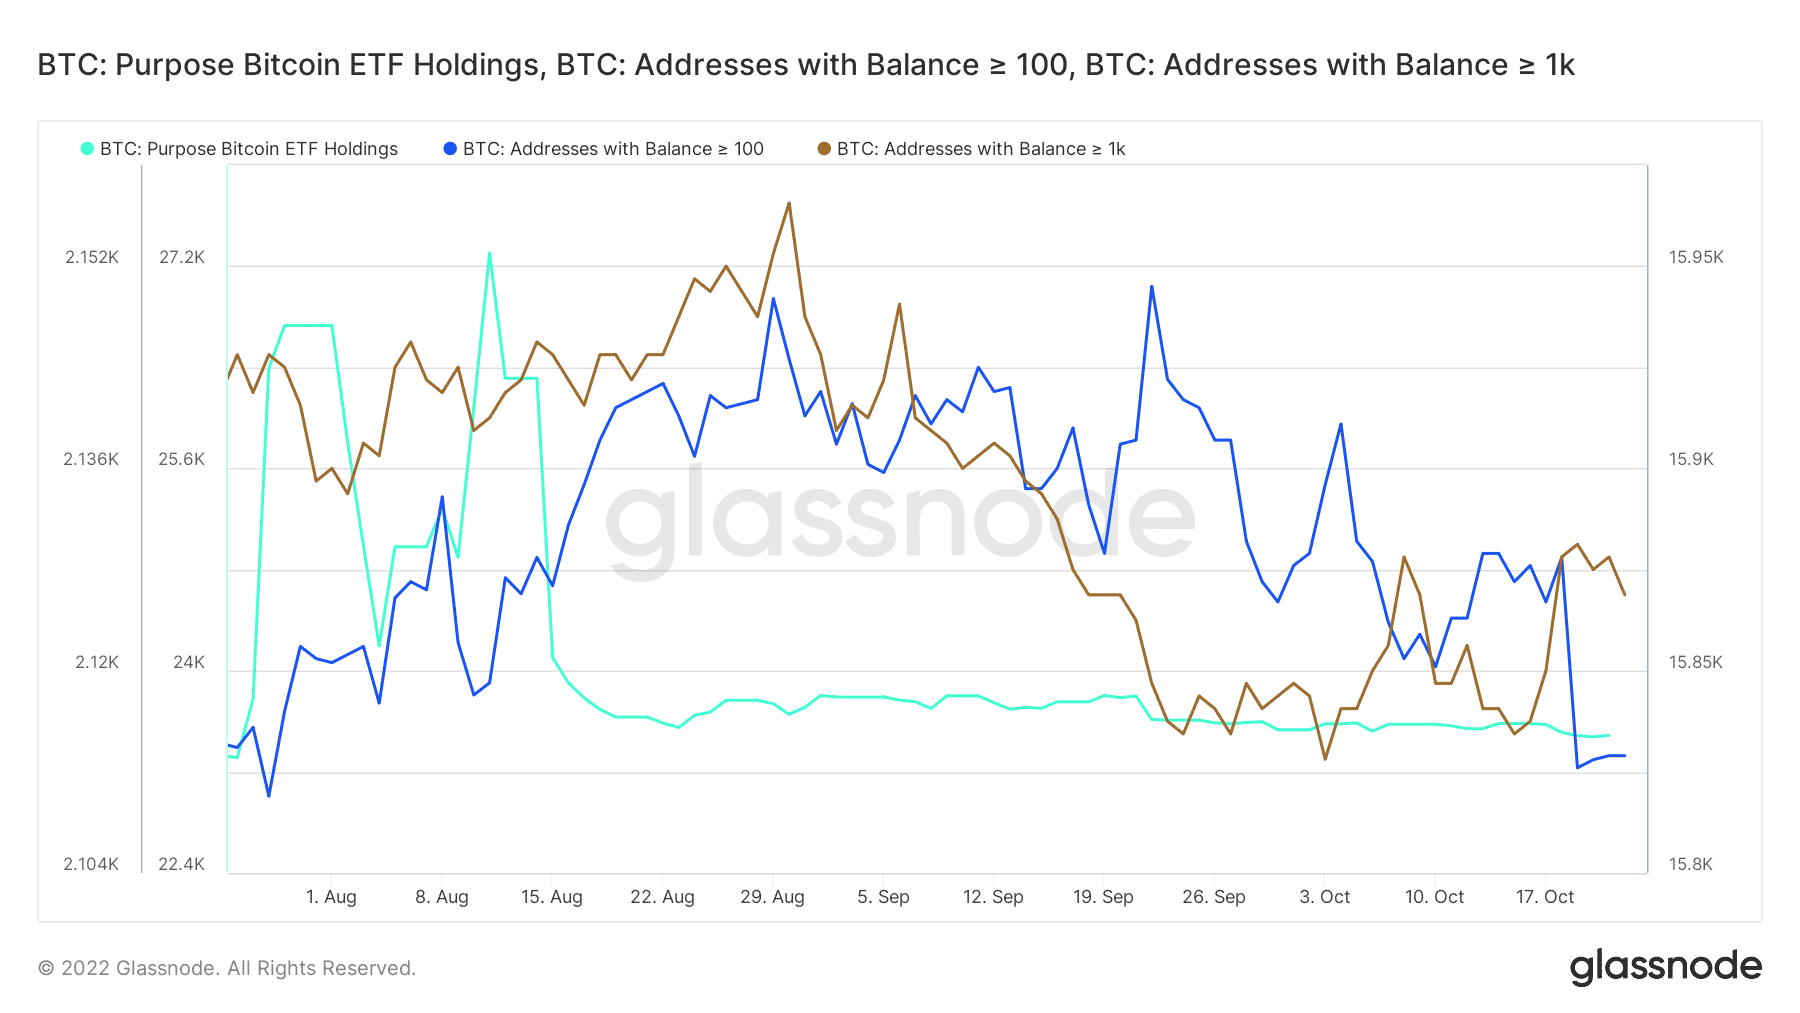
Here, it is also worth considering that the Purpose Bitcoin ETF Holdings, one of the top institutional indicators, remains near the lower range.
Conclusion
The lack of whale or institutional accumulation confirms that BTC has been experiencing low buying pressure. In fact, the recent outflows might be a sign that BTC has a higher chance of a break below support level.


