Bitcoin Cash: A 40% hike may be incoming from this setup

Disclaimer: The findings of the following analysis are the sole opinions of the writer and should not be taken as investment advice
A previous article chalked out Bitcoin Cash’s path to a lower high within a down-channel. From there, the price continued to trade within the pattern after a breakdown was denied, something that was expected due to some bearish signals in the market.
However, a longer timeframe revealed that BCH has been taking shape within a cup and handle setup. Moreover, a successful breakout from this bullish pattern would see a comeback above the $800-level. At the time of writing, BCH was trading at $641.8 with a market cap of $12.1 Billion.
Bitcoin Cash Daily Chart
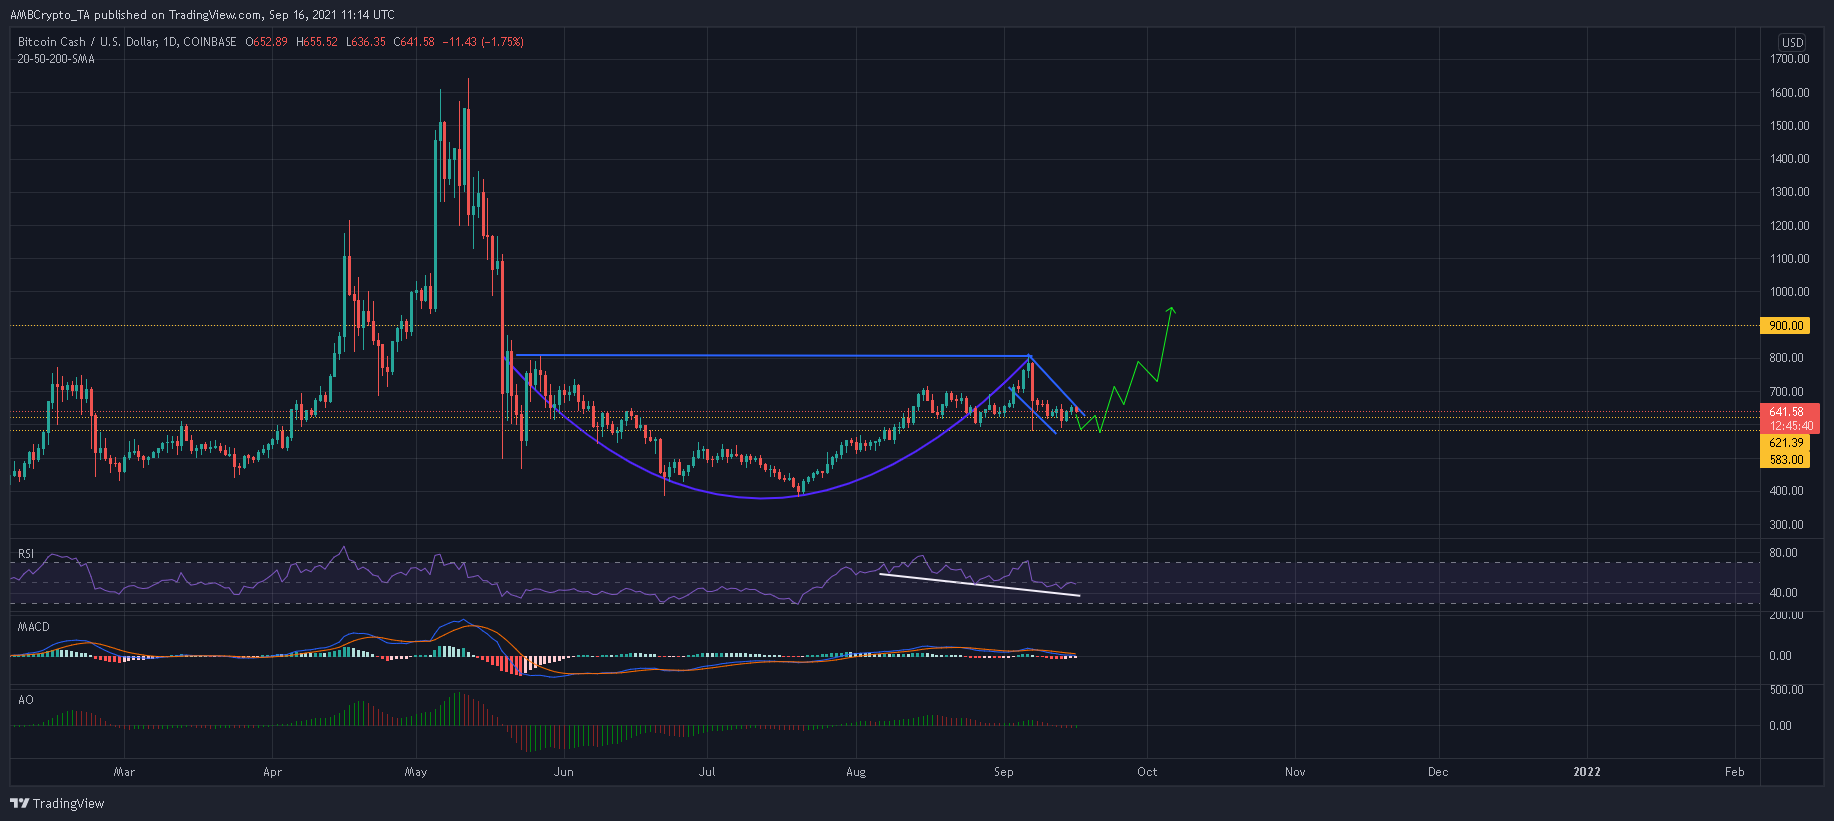
A closer look at BCH’s daily chart indicated a cup and handle pattern, one which emerged right after the wider market crash on 19 May. The pattern, which usually denotes a break to the upside, was forming its ‘handle’- identified by lower highs and lower lows – at press time.
Meanwhile, the horizontal trendline presented a resistance level of $800. Ideally, a bounceback from $583-$621 would trigger a breakout above the aforementioned resistance. From the same, the $900-level would be achievable. Overall, this would result in a 40% price hike from the setup.
To negate this thesis, BCH needs to close below the support line of $583. Support lines of $540 and $465 would take centerstage in case of this outcome.
Reasoning
Since the price was within the confines of a down-channel or the ‘handle,’ a few indicators did not line up favorably for BCH. The daily MACD threatened to move below the half-line after trading in bullish positions since early August.
The Awesome Oscillator breached equilibrium, although selling pressure was not too extreme. Conversely, while lower peaks were observed on the RSI, it maintained its position in neutral territory as market control hung in the balance.
Conclusion
Even though Bitcoin Cash’s indicators did not hold bullish positions, such readings were normal within a down-channel. In fact, a majority of the indicators were still above their half-lines – A good sign.
If BCH’s cup and handle pattern plays out as expected, the price would jump beyond $900 in the coming weeks. Meanwhile, traders can long BCH once the price dips between $583-$621.


