The broader market slowly moved north as buying pressure made an entrance. Bitcoin Cash, AAVE and Verge also followed suit. Bitcoin Cash rose 3.7% and was yet to topple over its immediate price ceiling. AAVE successfully held itself above its nearest support line and showed signs of consolidation with a minor increase of 1.9%. Verge noted an appreciation, however, its technical indicators were still bearish.
Bitcoin Cash (BCH)
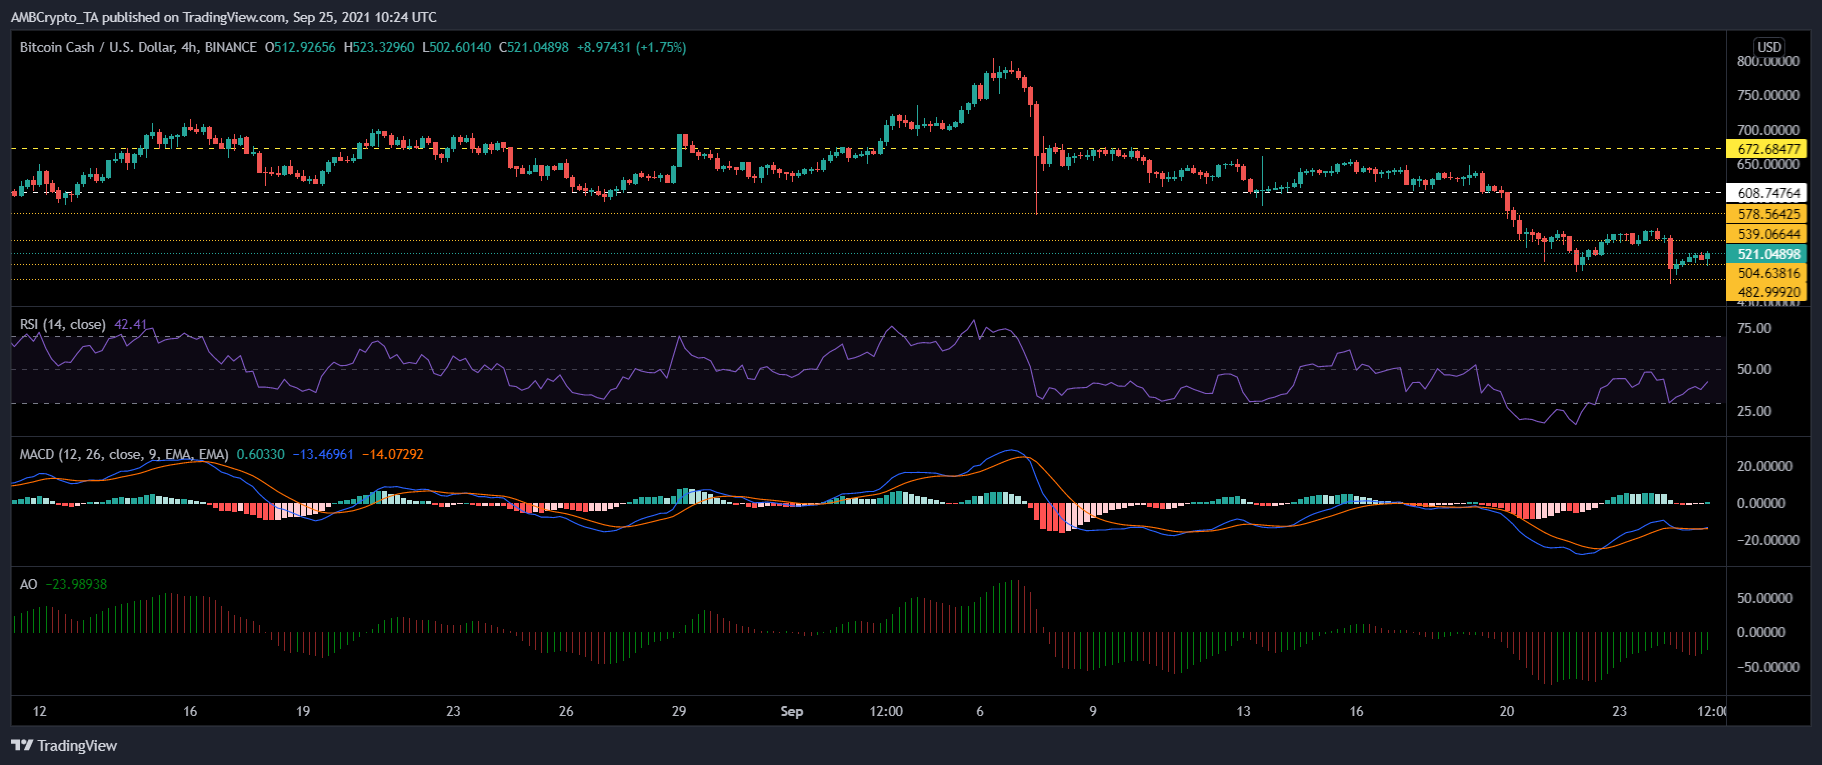
BCH/USD, TradingView
Bitcoin Cash climbed up the charts as the broader market showed signs of strength. Over the last 24 hours, the altcoin appreciated by 3.7% and was trading at $521.04. Its resistance mark lay at $539.06 and then at $578.56.
Additional price ceilings for Bitcoin Cash were at $608.74 and then at its one-week high of $672.68. As buying pressure recovered in the market, the parameters pointed towards a positive price action.
MACD flashed the onset of the green bars on its histogram, which signified a price reversal. Awesome Oscillator displayed green signal bars. Relative Strength Index rose up from the 25-mark and neared the half-line, displaying a drop in selling pressure.
If the buying pressure remains below the half-line, then prices could drag down to trade near the support line of $504.63 and then at the multi-month low of $482.99.
AAVE
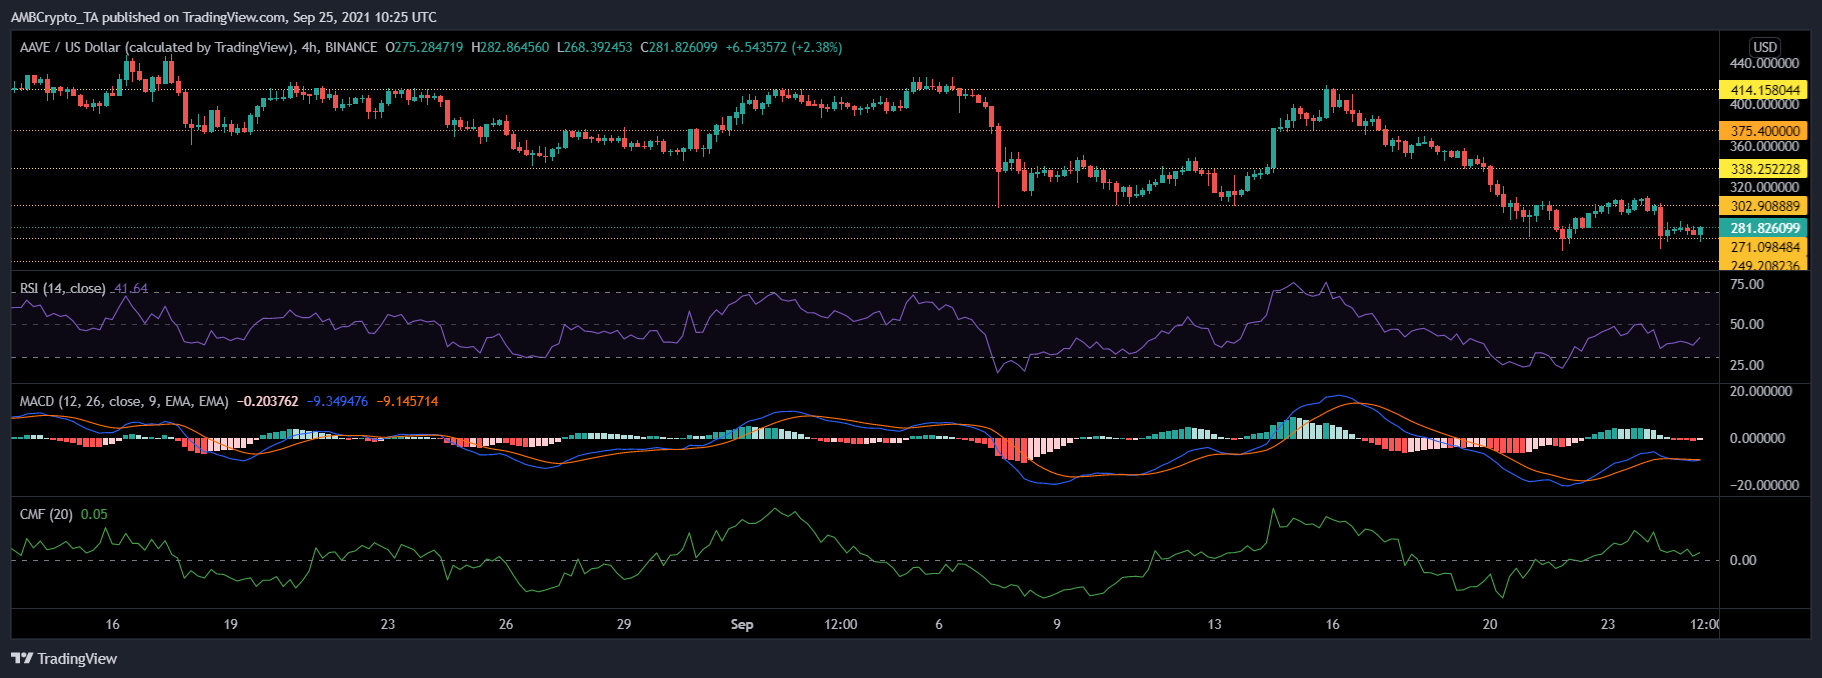
AAVE/USD, TradingView
AAVE also rose up by 1.9% over the last 24 hours and observed consolidation over the last trading sessions. The altcoin was trading at $281.82, and the next resistance was at $302.90. Additional price ceilings rested at $338.25 and then at $375.40. Indicators depicted that AAVE could be reviving.
Chaikin Money Flow was above the mid-line as the capital inflows were positive. Awesome Oscillator showed that red bars were receding over the previous trading sessions. The Relative Strength Index also went up towards the 50-mark as buying pressure showed signs of resurfacing in the market.
If AAVE rises on the upside, it could require buying pressure to move into the bullish territory. Remaining in the bearish zone could cause prices to drop down again. In that case, AAVE would find support at $271.09 and then at $249.20.
Verge (XVG)
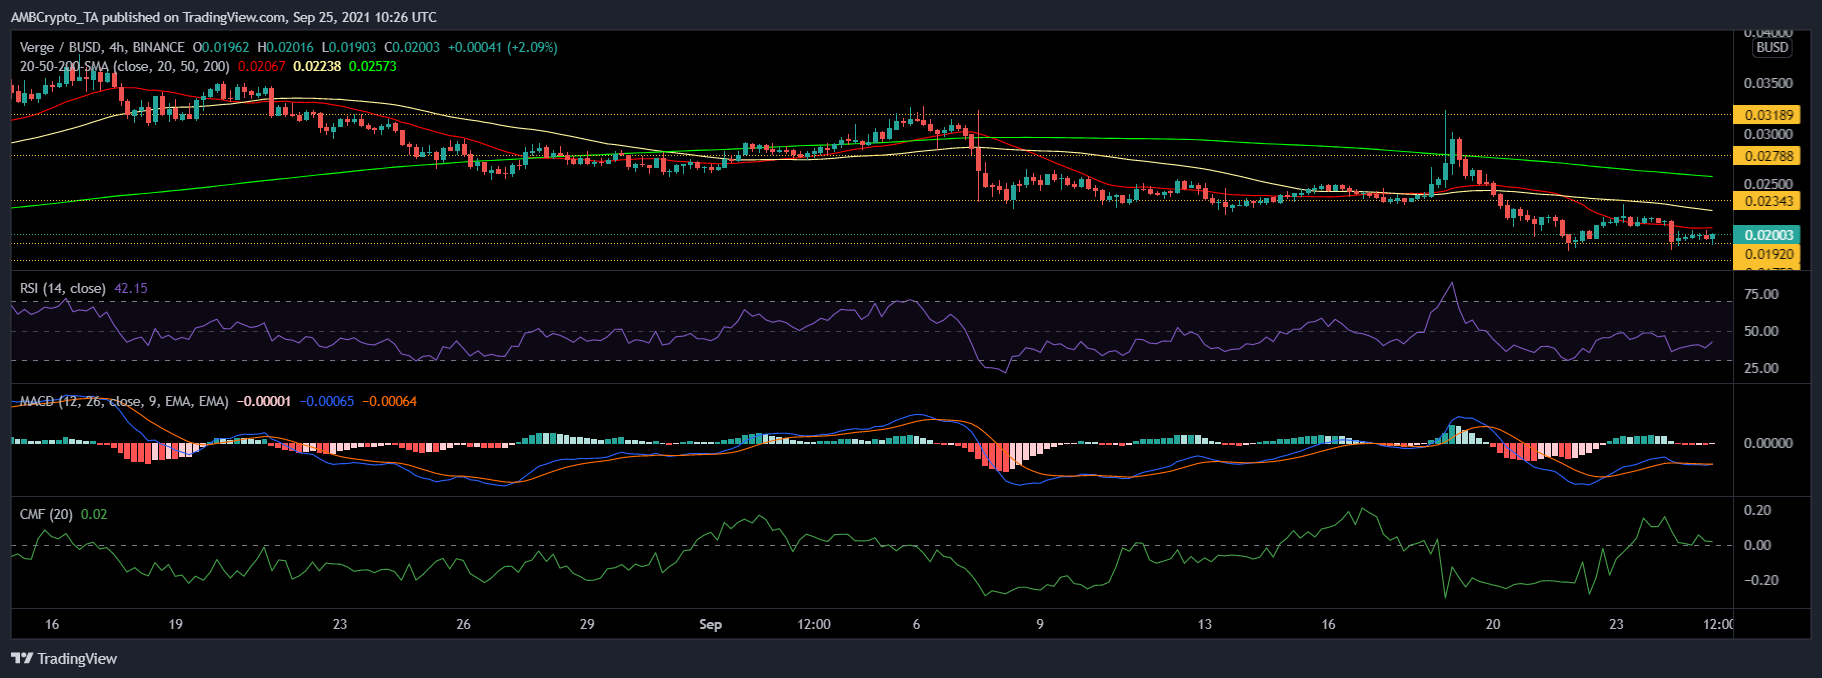
XVG/USD, TradingView
Verge also recovered 3.9% and was valued at $0.020. Indicators of the coin, however, weren’t quick to reflect its recovery. The key parameters still pointed towards bearishness. On the upside, the coin’s price ceilings stood at $0.023 and then at $0.027, which was Verge’s one-week high price mark. On the four-hour chart, the price of XVG remained below the 20-SMA line. This indicated that price momentum favoured sellers in the market.
Relative Strength Index noted an uptick although it was still within the bearish territory. MACD displayed flat red bars on its histogram which highlighted that a price reversal could be expected. Chaikin Money Flow remained above the half-line, although it threatened to fall below, if capital inflows don’t witness an influx.
In case the bearish pressure doesn’t fizzle out just yet, the nearest support region for the coin remained between $0.0192 and $0.170 respectively.