Bitcoin Cash could see a drawn out battle before reclaiming $800

Bitcoin Cash was challenging some rigid price barriers on its way to the $800-mark. The daily 50-SMA (yellow), 200-SMA (green) and 50% Fibonacci level posed as immediate hurdles to BCH’s price progression.
Meanwhile, an indecisive DMI and weakening MACD suggested that BCH could dip towards near-term defenses before gathering momentum to push higher. At the time of writing, BCH traded at $615.3, up by a marginal 0.7% over the last 24 hours.
BCH Daily Chart
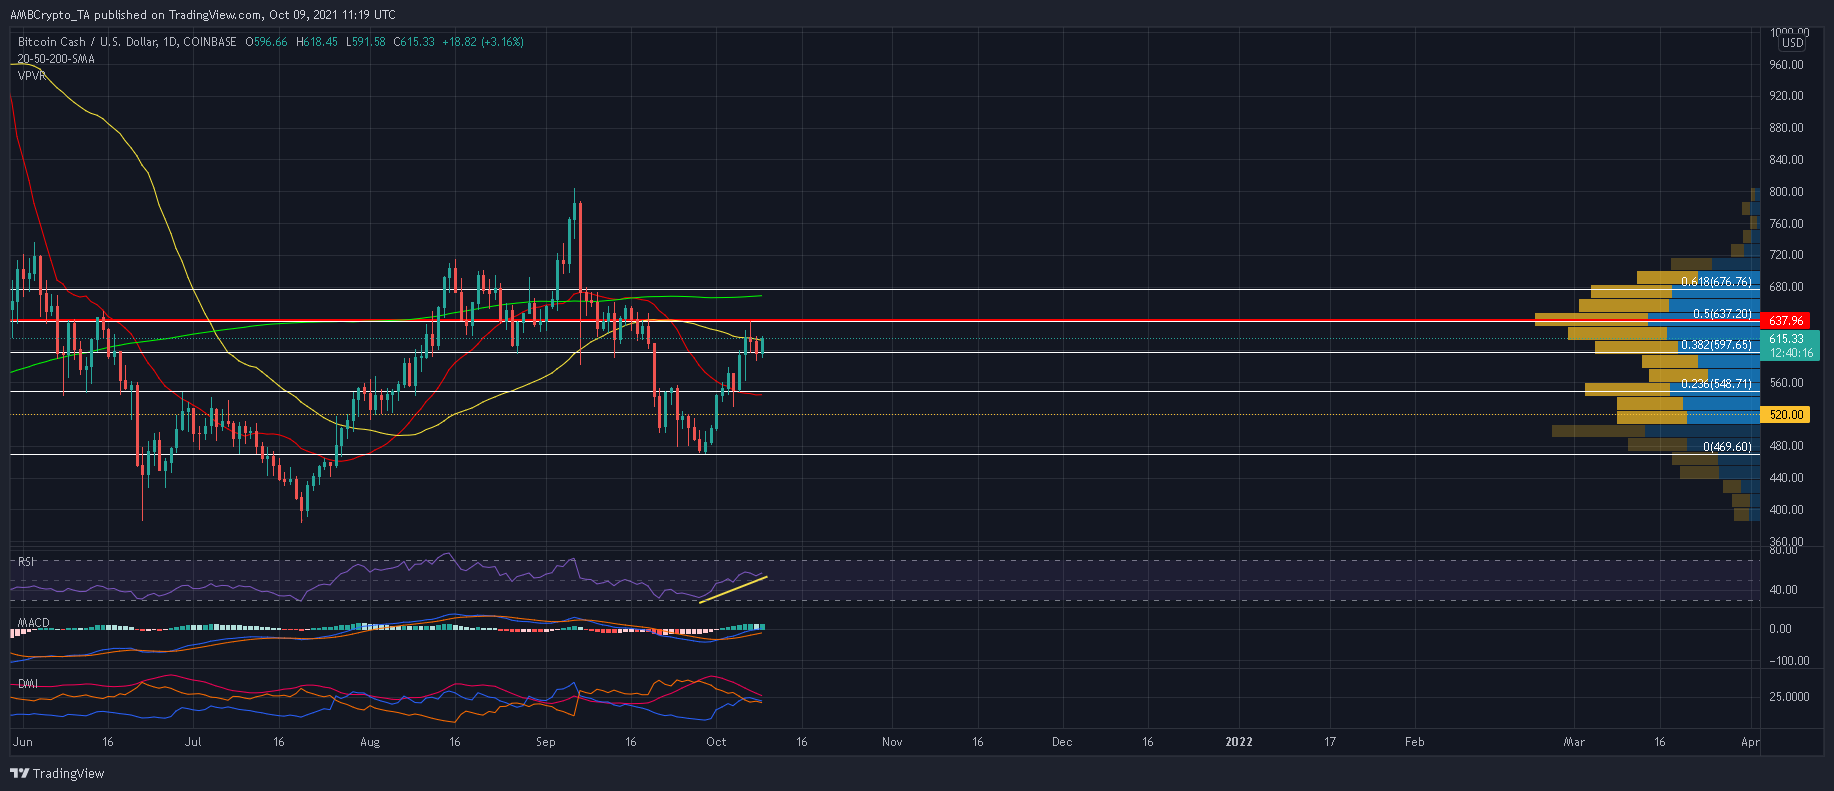
After shedding 42% of its value during since mid to late September, Bitcoin Cash witnessed a much needed rebound around the $470 price mark. The alt embarked on an upwards run and cleared the first few obstacles present at the 20-SMA (red) and 38.2% Fibonacci level.
In order to extend gains towards the September high of $805, BCH needed to negotiate past the 50-SMA and 50% Fibonacci level. The latter price mark also coincided with Visible Range’s POC and could be a tough nut to crack. From there, a close above the 61.8% Fibonacci level on strong volumes would open up a route back towards the local high.
On the other hand, this bullish bias will be lost if BCH concedes the 23.6% Fibonacci level to the bears. From there, short-sellers could initiate further drawdowns below the 20-SMA (red).
Reasoning
Now despite BCH’s pickup since late-September, bulls were not in the driver’s seat just yet. This was evident on the Directional Movement Index, which failed to identify a clear trend on either side. A weakening ADX also hinted at a period of consolidation before the next swing.
Meanwhile, the MACD was yet to recover above the half-line- a reading which was expected to keep bullish traders at an arms length. However, a strengthening RSI presented some counterarguments. The index suggested that bulls were gradually making headway in the market.
Conclusion
As buyers and sellers parlay in a hotly contested ground, expect BCH to trade sideways just above the 38.2% Fibonacci level. Once the broader market turns risk on, BCH would need to scale above the 61.8% Fibonacci level to reclaim the $800-mark.
Traders should wait for a bullish confirmation via the DMI, MACD and RSI before taking up any long positions. Although BCH presented only a handful of opportunities for short-sellers right now, traders can take up such positions in case the price slips below $550.


