Bitcoin Cash, Solana, Cosmos Price Analysis: 12 September

Bitcoin and Ethereum consolidated on their respective charts, however, some altcoins observed dissociated movements as they started dipping over the last 24 hours. Bitcoin Cash traded close to its one month low, after falling by 4.4%.
Cosmos too declined by 4.3%, heading towards its immediate support of $25.54. Solana, on the other hand, displayed a breather from its rally and was trading sideways.
Bitcoin Cash (BCH)

BCH/USD, TradingView
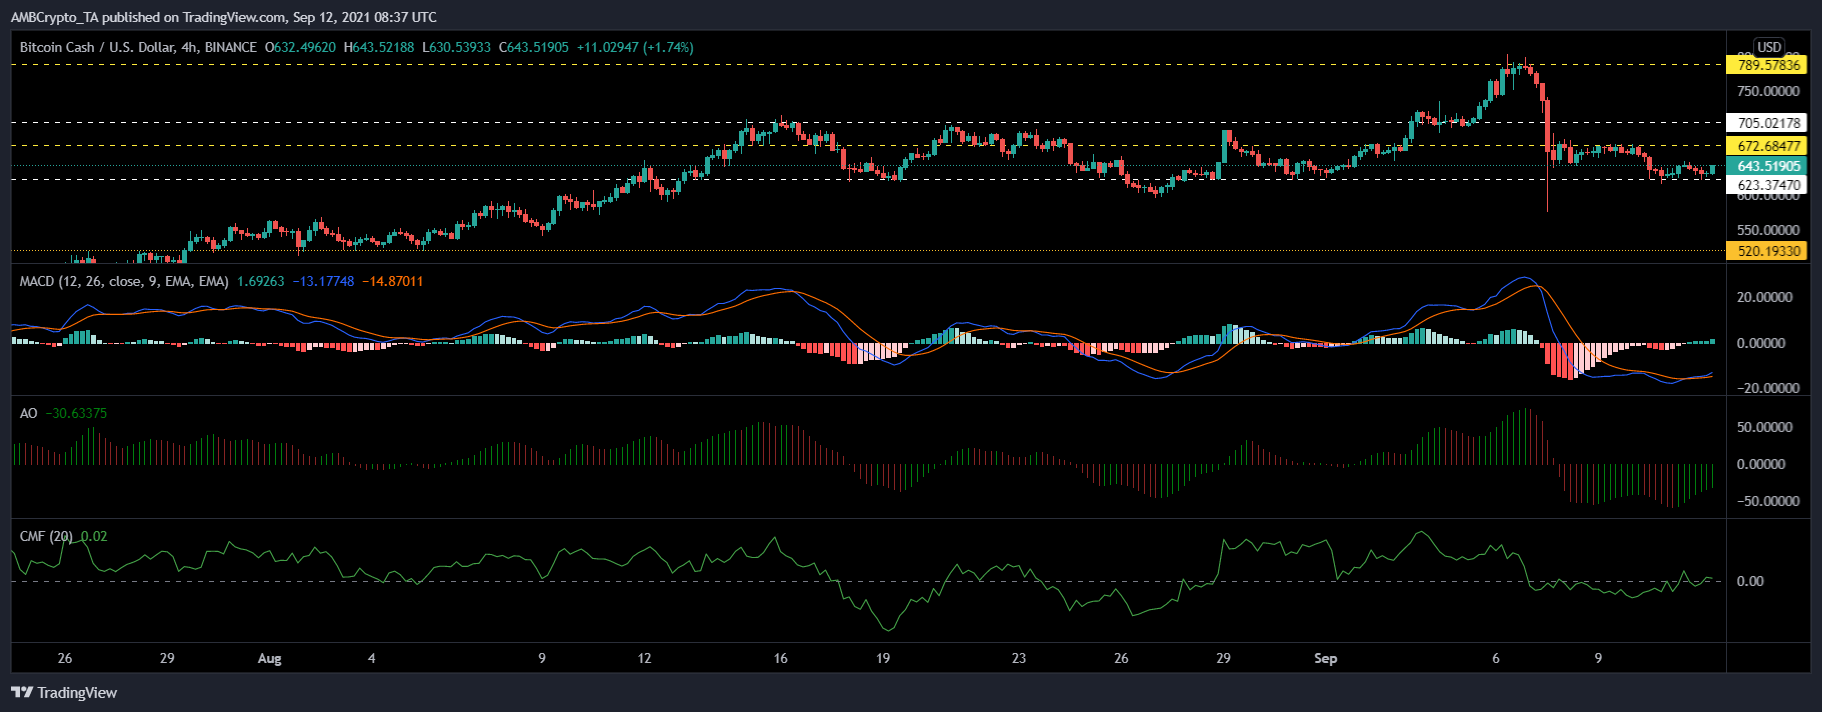
Bitcoin Cash fell by 4.4% and was trading at $643.51. The coin was currently trading near its one-month low price level. Another decline would push the coin below the $623.37 price floor. Although Bitcoin Cash fell on its charts, the indicators didn’t reflect the same movement.
MACD displayed green signal bars on its histogram, after a bullish crossover indicating that prices could be recovering over the upcoming trading sessions. Awesome Oscillator noted green signal bars as well. Chaikin Money Flow rose above the half-line indicating that capital inflows grew over the last trading sessions.
In case BCH revives its prices, the coin might topple over the $672.68 resistance mark and then revisit the one-week price level of $705.02. Upon maintaining prices above the aforementioned price ceiling, it can retest the multi-month high of $789.57.
Solana (SOL)

SOL/USD, TradingView
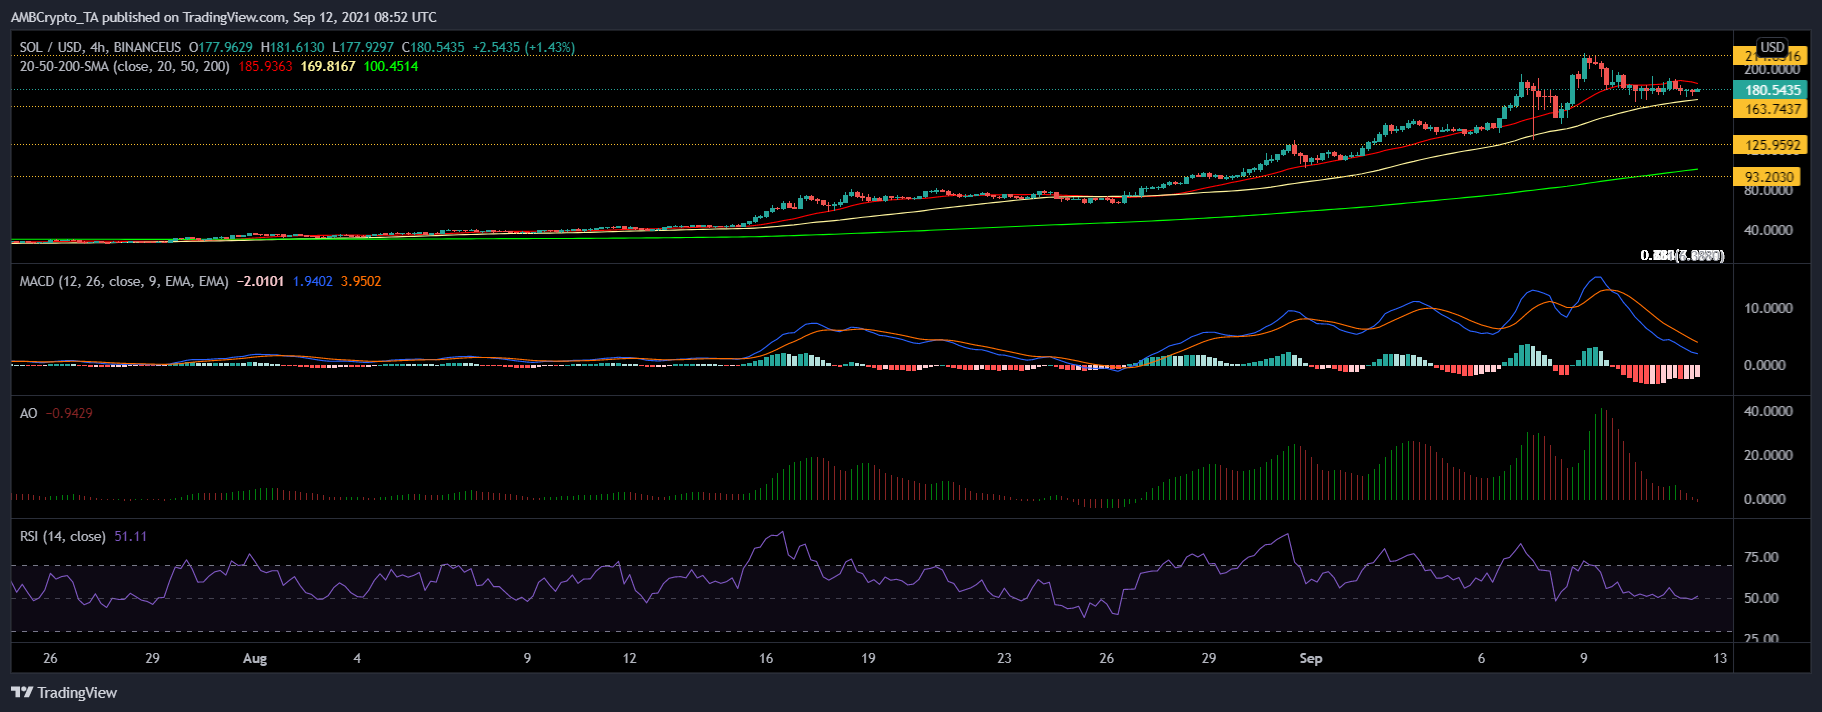
SOL demonstrated consolidation and dipped slightly on its charts by 1.7% over the last 24 hours. Solana’s uptrend took a pause, as buying pressure declined on the charts.
If SOL continues trading sideways over the next trading sessions, it could fall to its immediate support line of $163.74 and then to its one-month low of $125.95. Additional support level lay at $93.20.
Technical parameters for the coin pointed towards negative price action. As the 4-hour chart showed, prices were below the 20-SMA, implying that the momentum was in favor of sellers. MACD displayed red bars on its histogram.
The Awesome Oscillator flashed red signal bars and a sell signal. Relative Strength Index also registered a fall in buying pressure and threatened to fall below the half-line. On the flip side, the coin can revisit its all-time high of $214.96.
Cosmos (ATOM)

ATOM/USD, TradingView
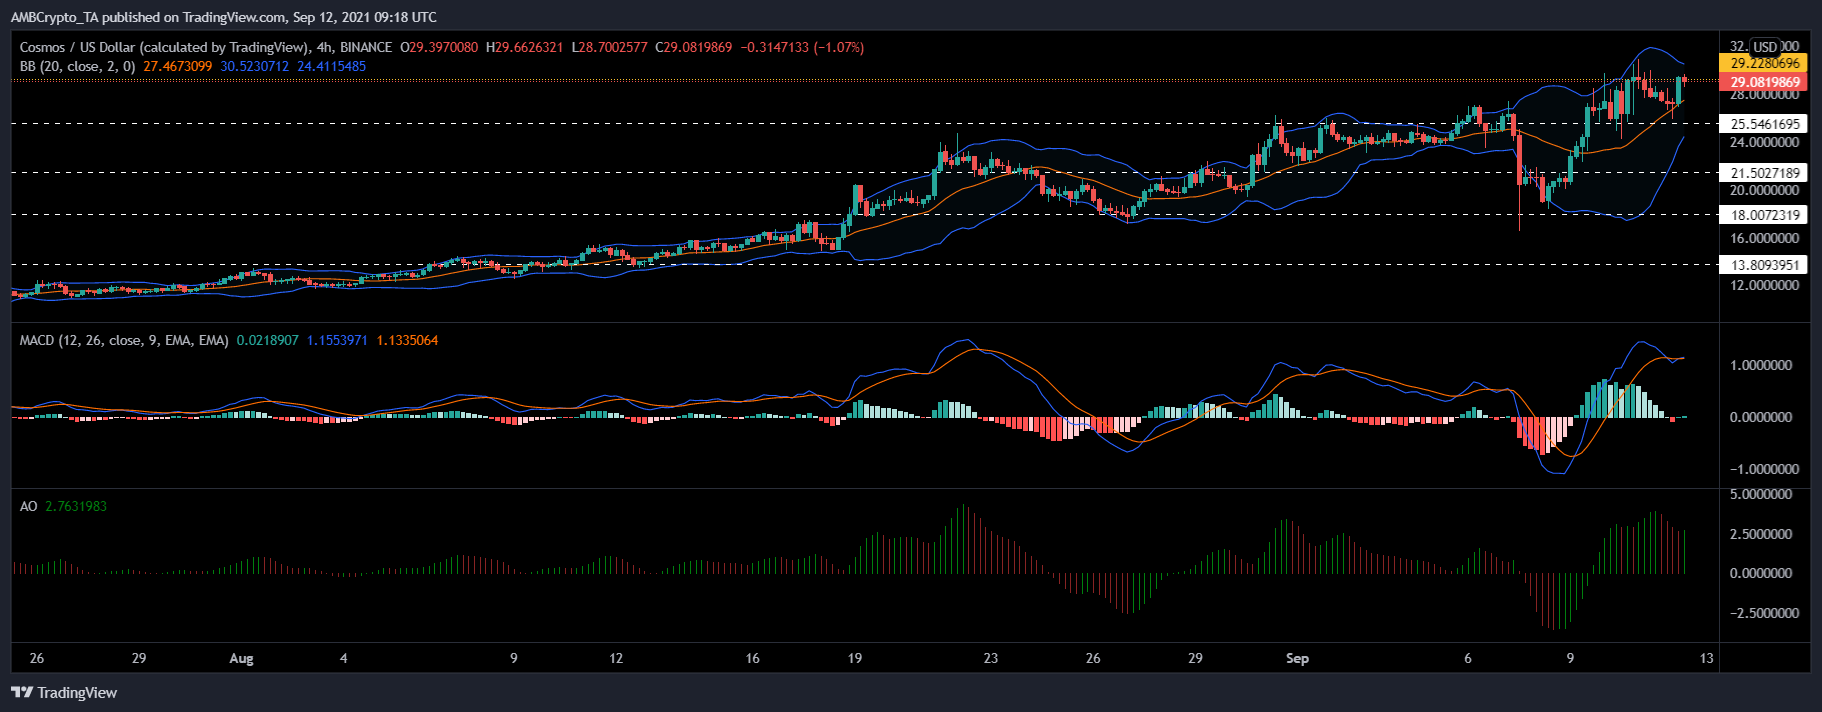
ATOM retreated downwards on its charts by 4.3% and was valued at $29.08. Despite rallying since 6 September and breaking through consecutive resistance levels, the coin’s uptrend took a halt. Its immediate support level lay at $25.54 and then at its one week low of $21.50.
In case ATOM fails to remain above the latter support level, the coin could dip to its three-week low of $18, the following price floor stood at a month’s low of $13.80. Technical indicators showed that ATOM might be headed towards price recovery.
MACD underwent a bullish crossover and displayed a green bar on its histogram. Awesome Oscillator showed a green signal bar as the previous trading session was in the green.
Bollinger Bands converged suggesting that volatility would remain low over the upcoming trading sessions. On the flip side, the coin could re-attempt to topple over its five-month high of $29.22.


![Uniswap [UNI] price prediction - Traders, expect THIS after altcoin's 14% hike!](https://ambcrypto.com/wp-content/uploads/2024/12/UNI-1-400x240.webp)


