Bitcoin Cash: Why this moving average could be key for a break to the upside
A series of lower highs and lower lows highlighted a descending channel as Bitcoin Cash continued to erase gains from the market. However, the 200-SMA (green) could act as a fail-safe against a breakdown and spur a fresh high within the pattern.
Considering a risk-off broader market, expect BCH to oscillate within its current pattern and rebound from a strong buy zone. At the time of writing, BCH traded at $574.4, down by 2.8% over the last 24 hours.
BCH 4-hour Chart
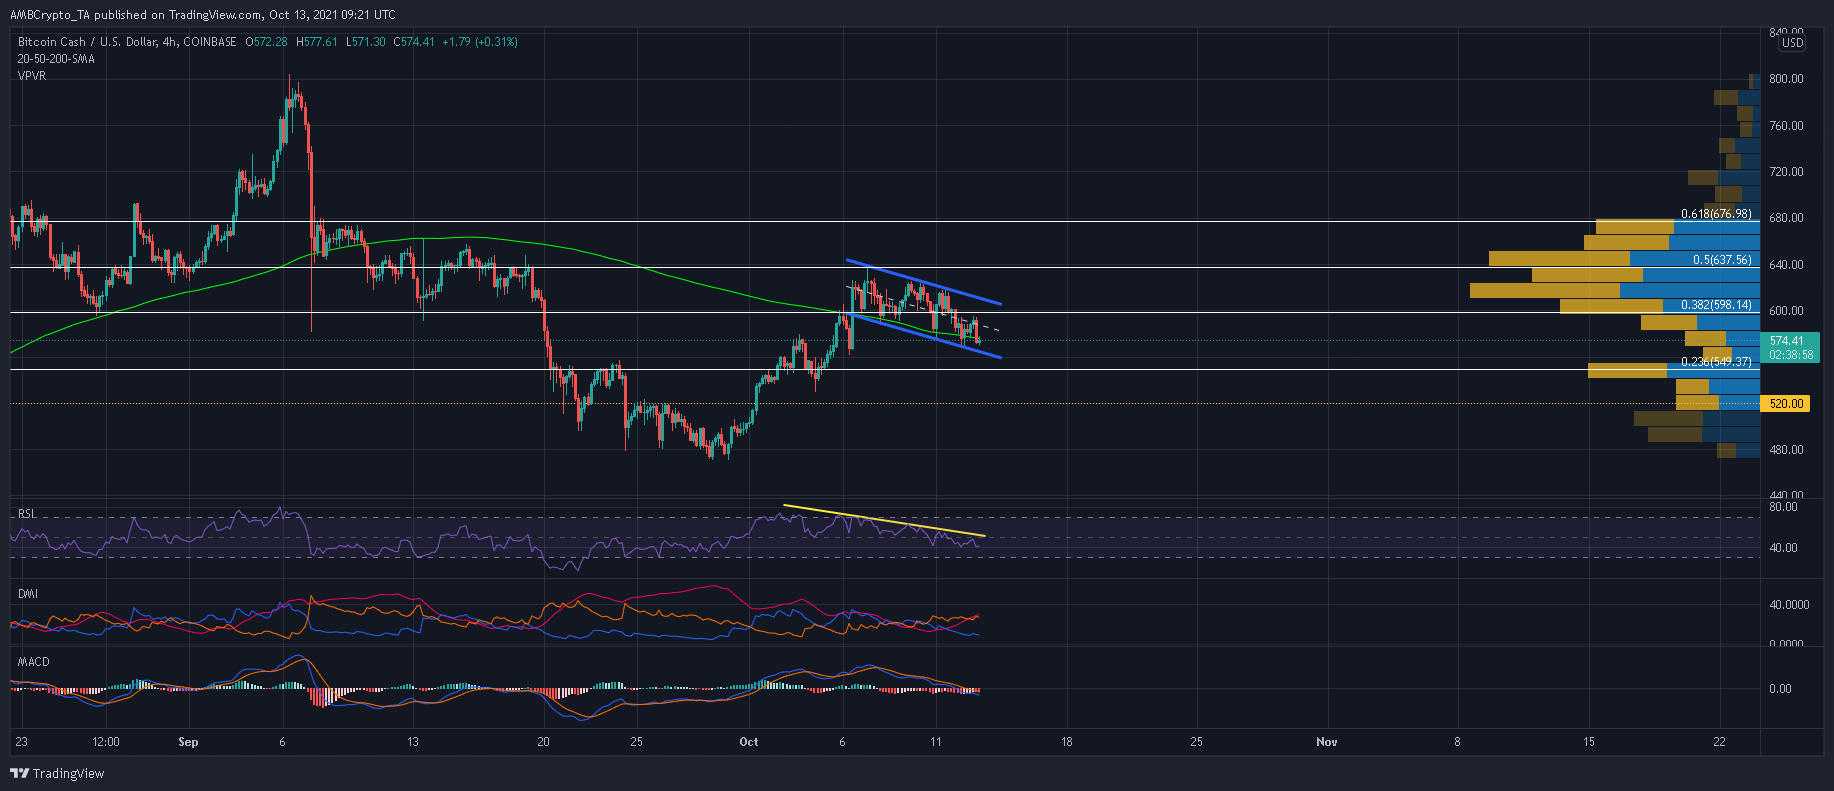
The 200-SMA (green) was key to BCH’s near-term trajectory. The candles have respected this moving average on five occasions so far, with almost each contact triggering a run up to the upper trendline.
A continuation of this trend would see BCH prepare for another high slightly above the $600-mark, provided the alt does not falter at mid-line of the pattern or the 38.2% Fibonacci level.
With weak inflows across the broader market, an early upwards breakout would most likely be met with immediate rejection, within the pattern. Ideally, the stronger demand area at 23.6% Fibonacci level would be a better fit to enforce a breakout from the pattern.
Meanwhile, near-term traders need to be cautious of a breakdown to $520. A weakening RSI and unfavorable DMI presented opportunities for more sellers to jump on board.
Reasoning
Now the 4-hour RSI has been declining since early October and confirmed with BCH’s price action. With RSI now below the mid-line, some more losses were anticipated before a reversal. Moreover, a bearish DMI coupled with an ADX reading of 33 meant that BCH’s downtrend was gaining more steam.
Finally, the MACD did little to alleviate any fears of a market decline. In fact, short-selling was a threat after the index made its way below the half-line.
Conclusion
The 200-SMA (green) could provide an immediate response to the burgeoning selling pressure in the market. However, expect the lower trendline to be tested on a few more occasions over the next 24 hours. If BCH does maintain its ground within the pattern, buyers can punch back the 23.6% Fibonacci level and trigger a break to the upside.


