Bitcoin: Investors should not fear a prolonged decline unless…

Disclaimer: The findings of the following analysis are the sole opinions of the writer and should not be taken as investment advice
Bitcoin’s latest decline did raise a lot of question marks about its long-term trajectory. After all, the world’s largest digital asset plummeted by 11% on a single day – Its largest percentage drop since 21 June. If the candlewick is taken into account, losses went as steep as 19.2%. Such drawdowns often trigger panic selling across the altcoin market – Something which was evident over the last couple of days.
While retail traders do take significant damage, it is important to gauge the BTC market with a wider perspective. In fact, a closer look at BTC’s daily chart revealed that the price is still holding above key levels. What’s more, its latest decline did not carry a major threat, not yet.
Bitcoin Daily Chart
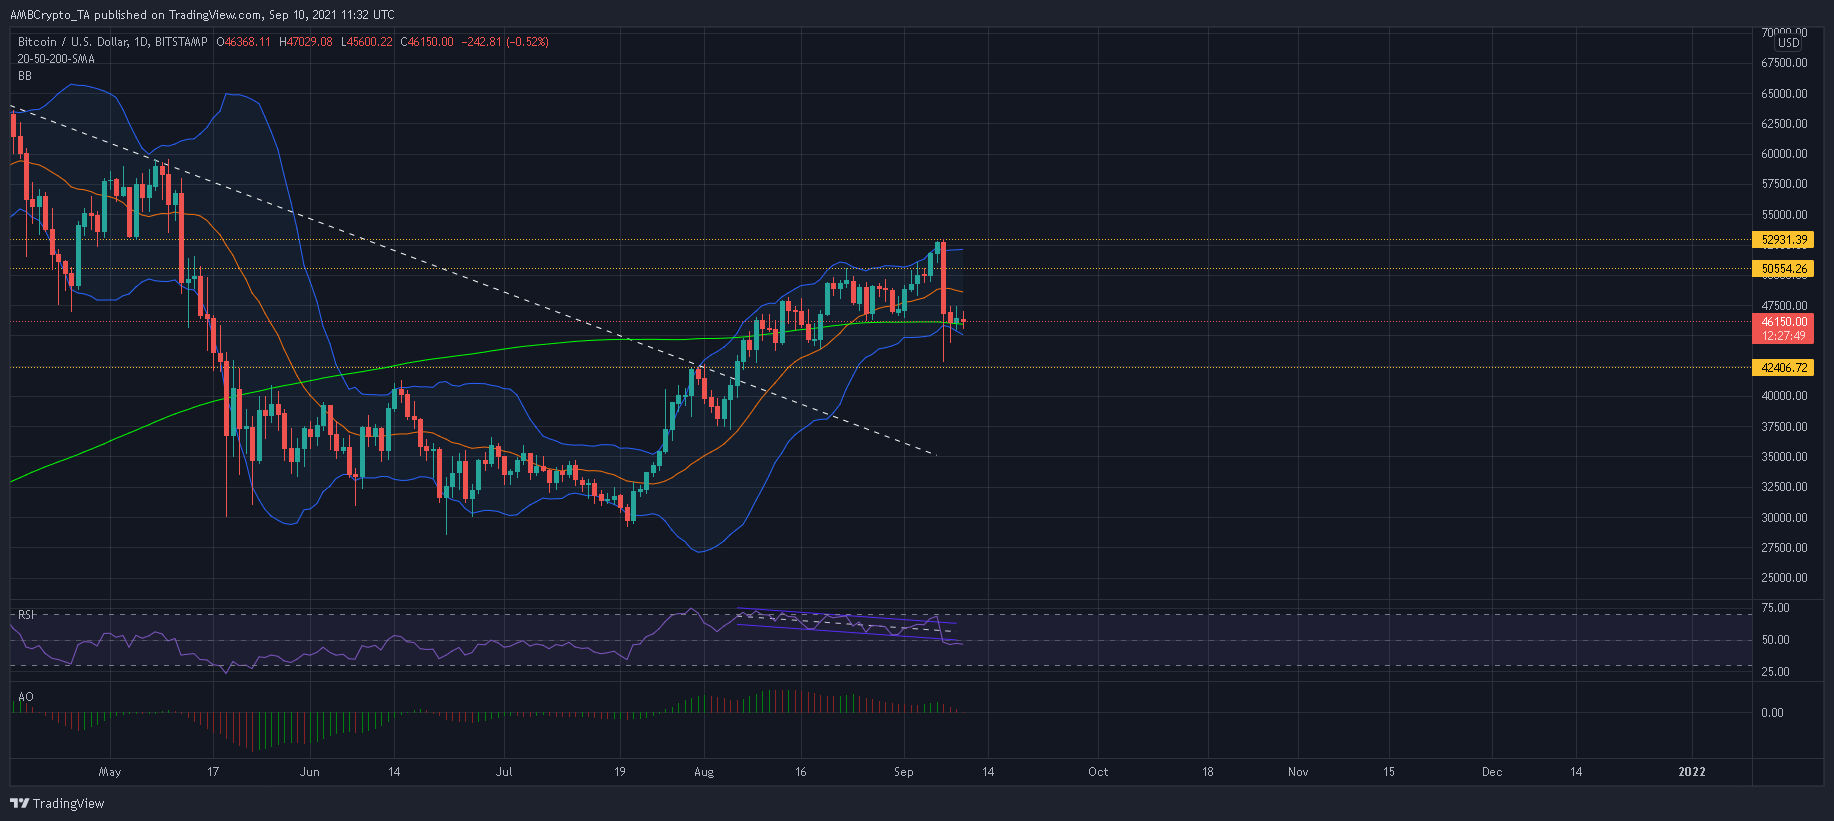
BTC’s chart underlined an interesting relationship with its 200-SMA (green). More often than not, a close below this long-term moving average has led to a prolonged bear market.
Take the 19 May sell-off, for example. It took BTC nearly 3 months to decisively close above this line after witnessing lows that extended all the way up to $29,400. Sometimes, a drop below the 200-SMA can even lead to an immediate bullish resurgence. This occurred thrice in early August as buyers denied a southbound move. If the latter trend continues this time as well, market observers need not fear an extended sell-off.
Now, judging from BTC’s movements since late July, the digital asset has been on a clear uptrend. Higher highs and higher lows were interrupted by impulsive drawdowns, but resistance barriers were eventually toppled. To disrupt this trend, BTC would need to close below 12 August’s swing low of $43,800.
From there, a breach below $42,400 would sound warning bells across the market.
Realistically, the next few days could result in some sideways movement below the 20-SMA (red) as the price stabilizes. Expect buyers to be back in control once BTC breaks decisively above its 20-SMA.
Reasoning
Bitcoin was trading at the lower end of its Bollinger Bands for the first time since 21 July. Over the past few months, BTC has bounced back each time from the lower band and the same can be expected going forward as well. However, the 20-SMA (red) would restrict near-term gains.
The RSI’s dip below a down-channel was somewhat troubling, but an uptrend is not usually disturbed till the index hovers above 40-45. On the downside, lower peaks were observed on the Awesome Oscillator. This meant that buying pressure was gradually eroding across the market.
Conclusion
Flash crashes are scary phenomena. especially in the BTC market. Indicators usually switch to bearish positions and there is always the chance of an extended decline.
However, such corrections are considered healthy over the longer run. While the market could trickle lower, BTC would need to hold above $43,800 for a faster recovery on the charts. Observers need not fear a prolonged decline as long as Bitcoin holds its position above $42,400.