Bitcoin, Litecoin, Chainlink Price Analysis: 22 June

Bitcoin fell by nearly 22% over the weekend owing to the latest in China’s mining crackdown episode. Needless to say, most altcoins plummeted too and the volatility showed no signs of settling down. Litecoin fell by almost 14% over the past 24 hours, followed by Chainlink, with the latter depreciating by 12.3% over the same period.
Bitcoin [BTC]
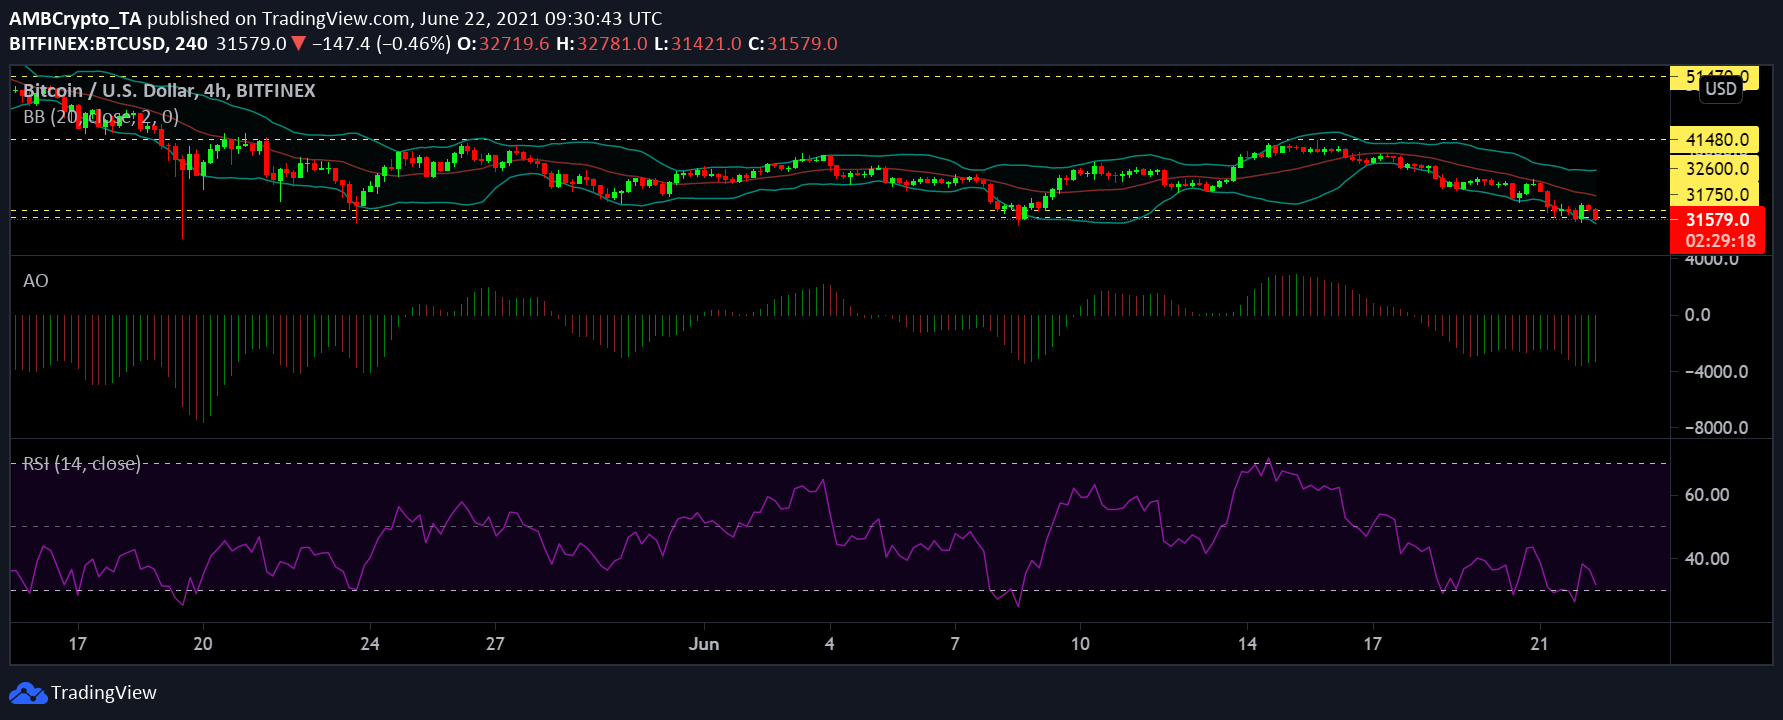
Bitcoin‘s prices have fallen for most of the last week. It had climbed to around $41,500 on 14 June, post which its price dipped again. At press time, BTC was trading in red and was valued at $31,600. Bears have been dominant for almost a week and a half now and on the 4-hour trading chart, the coin had still not embarked on its journey to recovery.
Bitcoin’s market capitalization fell by 3.3%, at the time of writing, and BTC was down by 22.1% in 7 days. Bitcoin has held on to the $32,600-support level since 8 June. However, at press time, it had broken and fell below that support level to $31,600.
The market noted a hike in selling pressure as the coin hovered near the 30-mark on the Relative Strength Index. The Awesome Oscillator gave off mixed signals with mostly bearish signals coupled with a few bullish trading sessions in the middle as prices picked up and fell off quite a bit over the past week.
With respect to price fluctuations, the Bollinger Bands pictured the widening of the bands, a sign that price volatility can be expected over the next few trading sessions.
Litecoin [LTC]
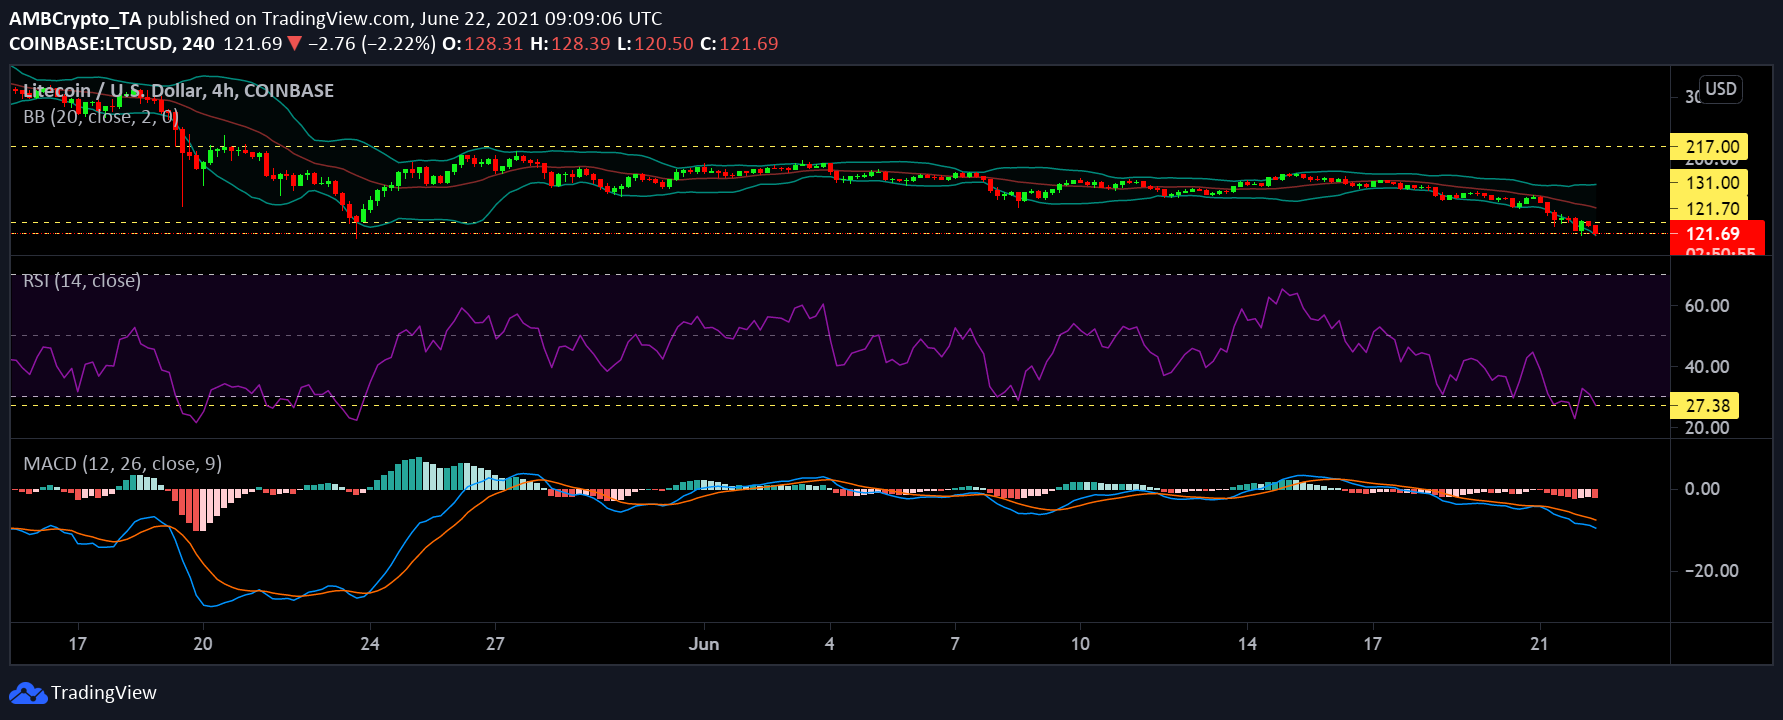
The alt mostly noted lateral movement across the charts for most of this month, however, the last few days were rocky for LTC as it fell below the $131-support level. At the time of writing, LTC was priced at $120.62 – The lowest level the coin has hit since the crypto-crash in May.
If Litecoin‘s press time price holds, then the coin can start seeing some price corrections. The Bollinger Bands had moved upwards with a slight divergence, one which indicated that there could be some price volatility.
The MACD’s histogram pictured a bearish crossover on 16 June and since then, the coin has moved on with bearish momentum. Litecoin also fell below the oversold and undervalued zone with sellers heavily outnumbering buyers as the Relative Strength Index indicator was below the 30-mark.
Chainlink [LINK]
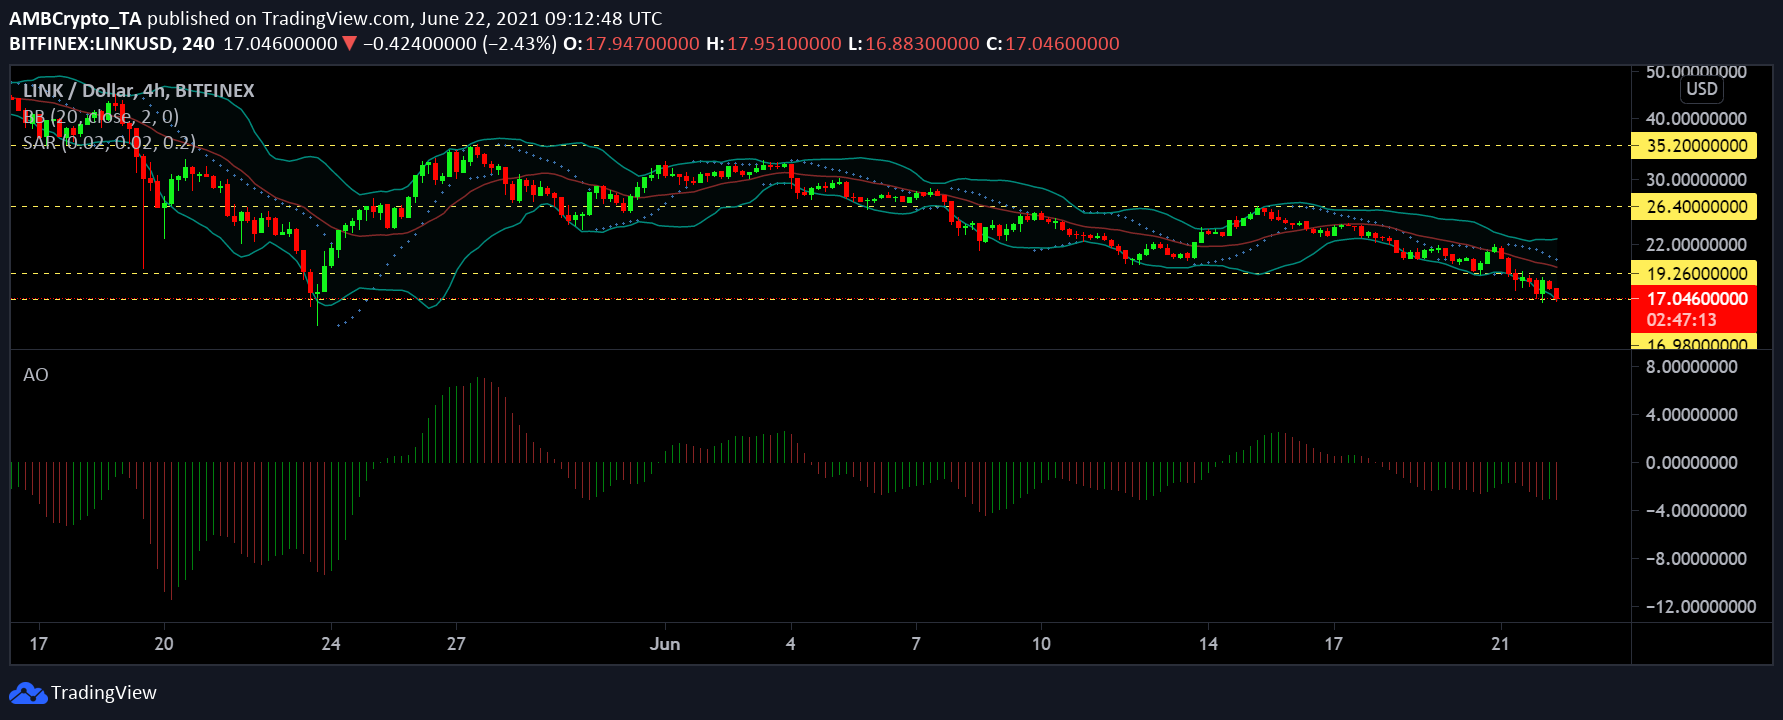
Chainlink dove below its crucial support level of $19.2 over the past 48 hours. LINK had stayed above the $19.2-support level ever since it saw a dip in prices in the month of May owing to the crypto-crash. At the time of writing, LINK found support at $17.04.
The Bollinger Bands remained divergent at press time, a finding that pointed to increased price volatility. As the alt’s price fell on 21 June, the Parabolic SAR highlighted the beginning of a downtrend and it continued to show the same at the time of writing.
Finally, the Awesome Oscillator suggested that bearish momentum was dominant owing to the presence of multiple red bars on the histogram.


