Bitcoin, MATIC and AAVE Price Analysis: June 28

As Bitcoin’s price movements have been choppy lately, most altcoins have also experienced price volatility. With Bitcoin’s increase in prices by 4.9% in the past 24 hours, altcoins have been trading green after registering recovery on the 4-hour trading charts. Matic rose by 4.0% and AAVE recorded a 5.15% increase in prices in the last 24 hours.
Bitcoin
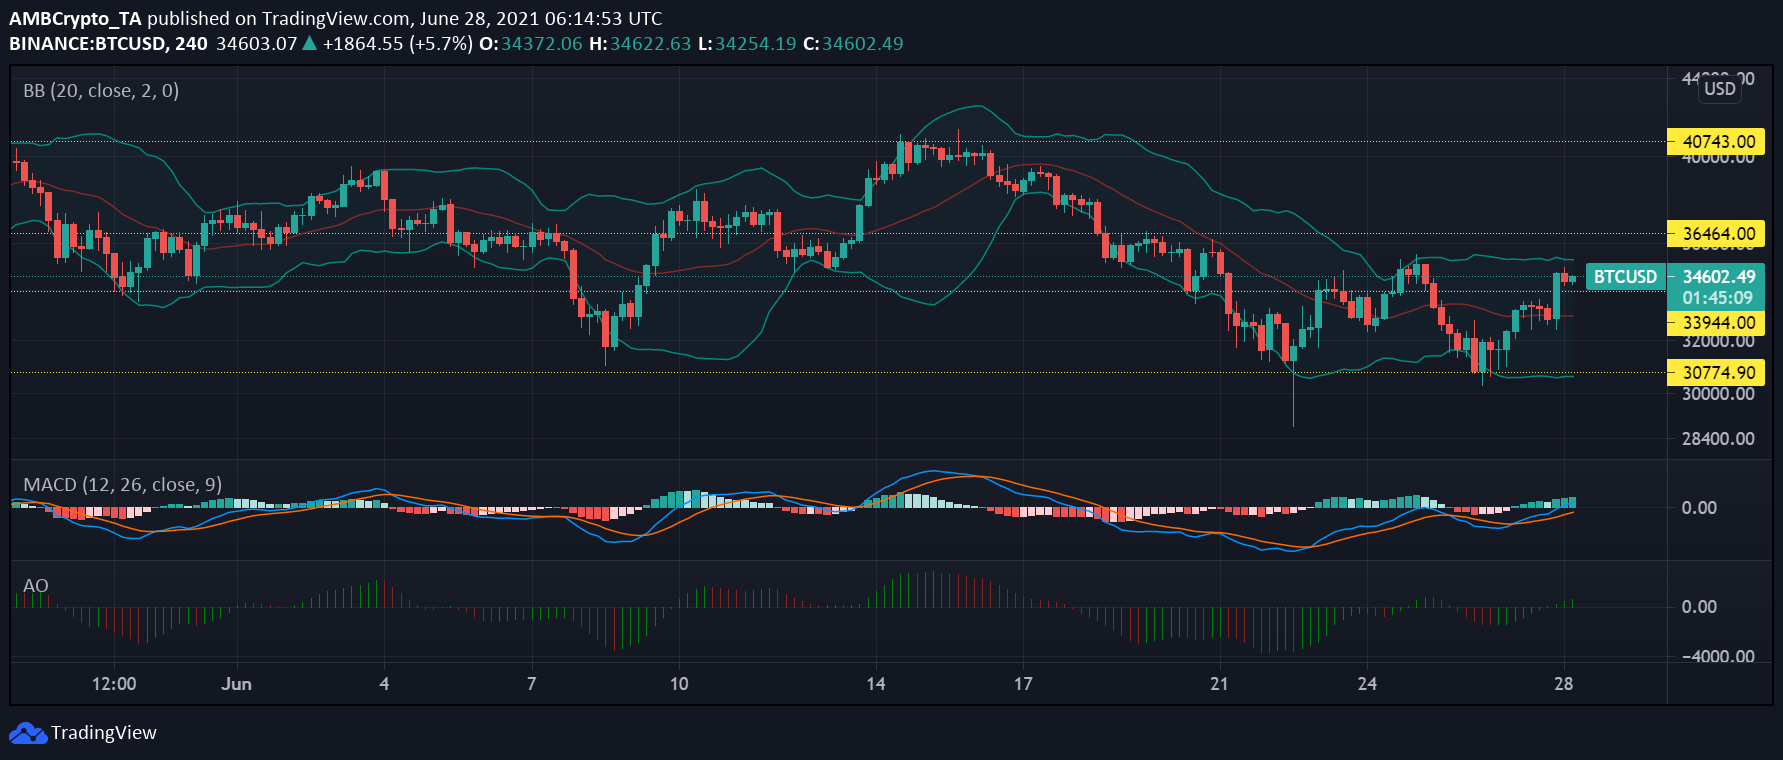
At the time of writing, Bitcoin’s prices were $34,666.45 which is 4.9% higher than it was 24 hours ago. Bitcoin’s prices have been on a rise since June 26. The coin had broken off its key support level of $30,000 on June 22, however, the king coin had staged a rebound above the $34,000 just a few days back
Bollinger Bands for the asset pictured a parallel movement which meant that the coin will witness restricted price movements. With the continued ascending price movement, BTC could experience resistance at $36,000. Bullish momentum could be observed building on the Awesome Oscillator Indicator as the green bars were seen above the zero-line.
Finally, at the time of writing, MACD histograms also depicted a bullish momentum with a bullish crossover that occurred on June 27, a reading that signified that prices could be on a rise.
MATIC
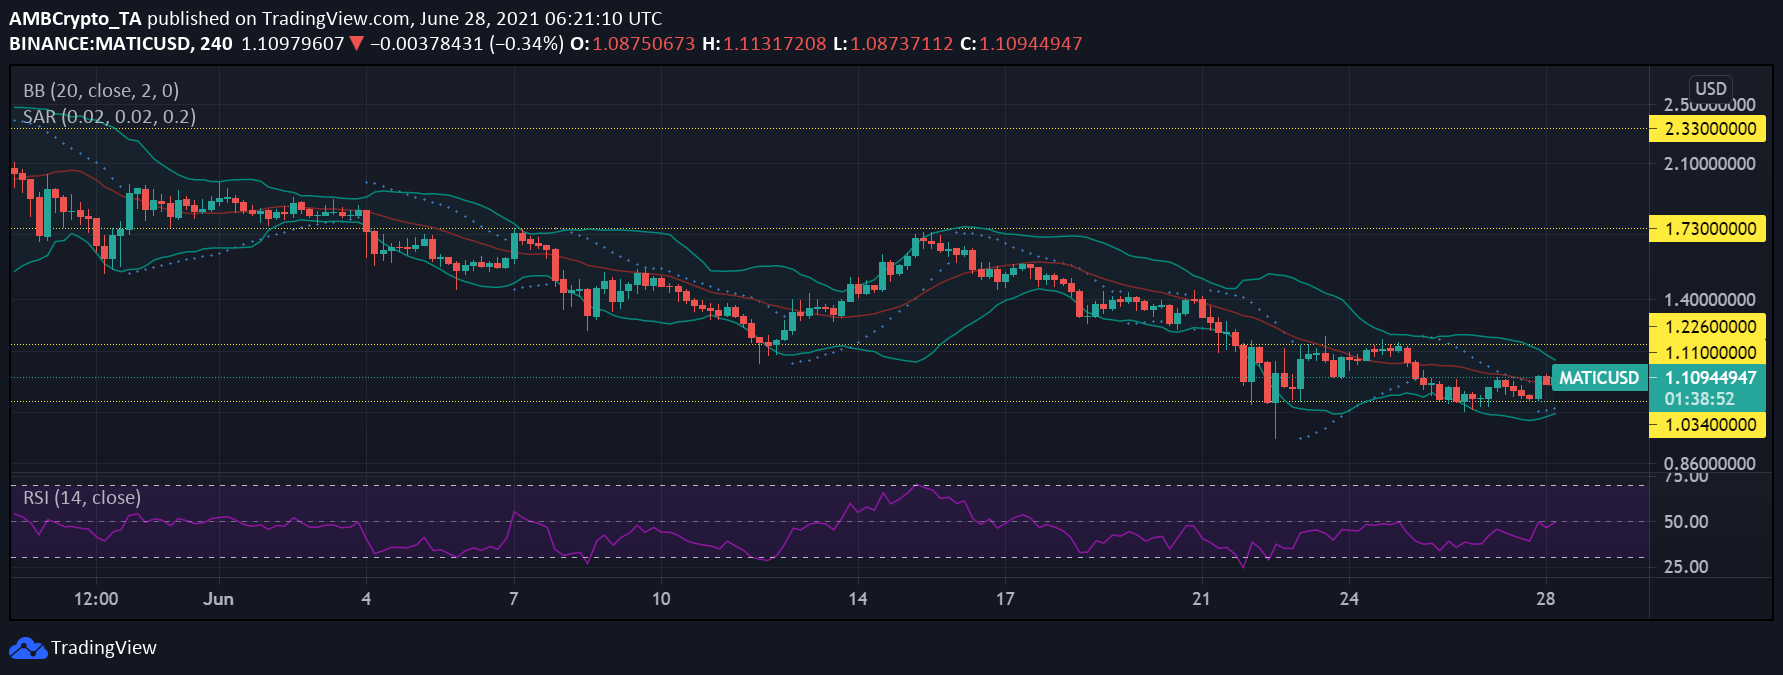
Matic was trading at $1.11, at press time after witnessing a decline of 20.9% since last week and a 4.0% increase over the last 24 hours. The coin has been oscillating between its immediate support and resistance level of $1.03 and $1.22, respectively. With prices increasing further, the coin would test the $1.22 level moving forward.
Relative Strength Index for Matic neared the neutral zone after it witnessed a slight uptick which signified an increase in buying pressure at press time. The Bollinger Bands noted convergence in the 4-hour trading chart which meant that the coin would experience low levels of price volatility.
In correspondence to Matic’s price escalation, Parabolic SAR exhibited an uptrend as the dotted lines were visible below the candlesticks at press time.
AAVE
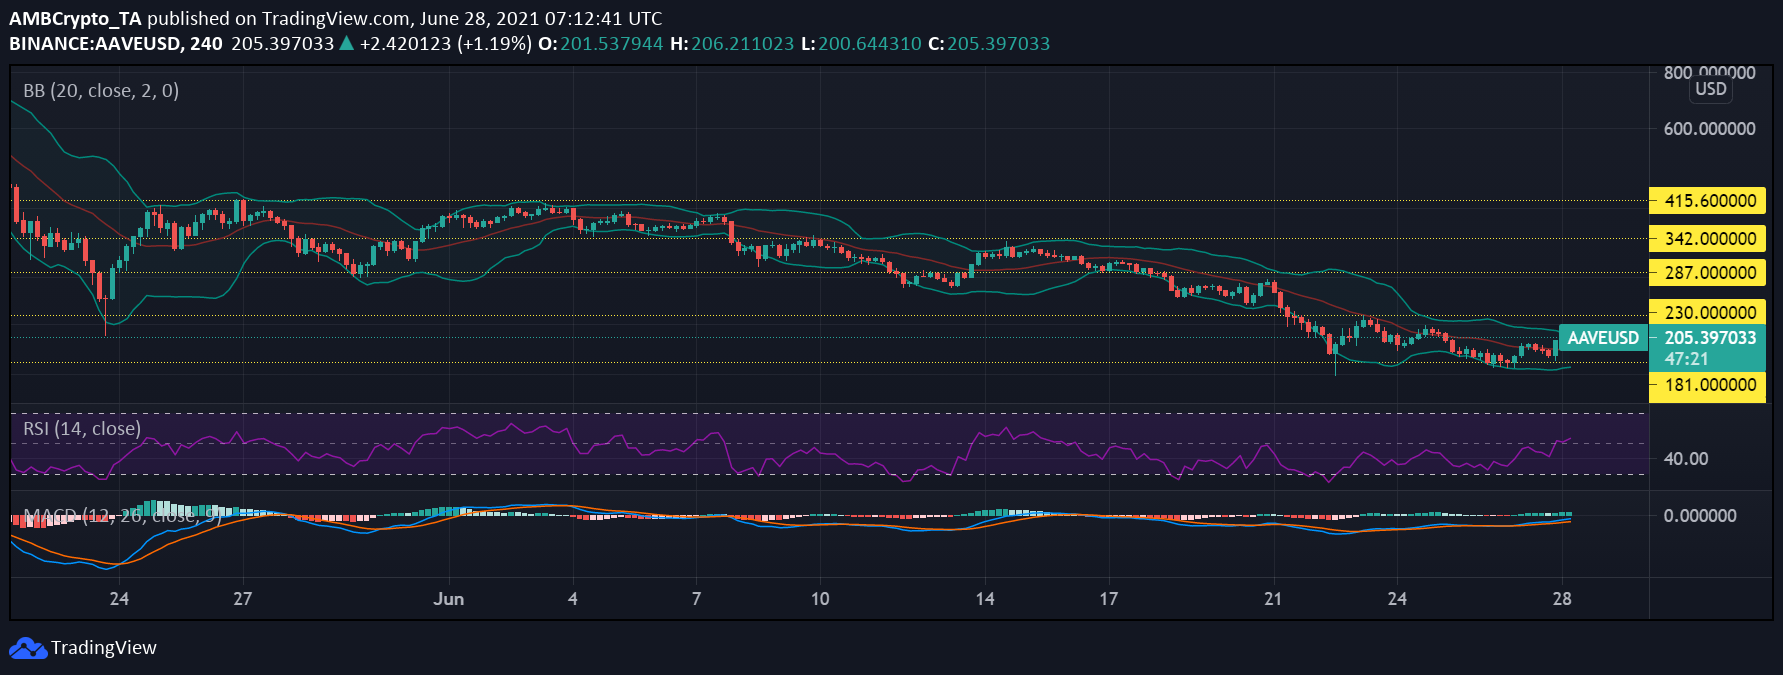
AAVE’s price movement has been restricted between the $181 and $230 support and resistance levels for the past week. The coin recorded a 5.1% increase in prices in the last 24 hours, at press time the coin was trading in green at $205.51. In case of a sustained uptrend in prices, the coin’s next resistance level would be $230.
Relative Strength Index was pictured moving above the neutral zone, which signified that buyers preceded sellers in the market. MACD histograms depicted a bullish momentum and also a bullish crossover on June 27.
With regard to price fluctuations or price volatility, Bollinger Bands narrowed at press time, which suggested that AAVE would not witness heavy price fluctuations.