Monero, AAVE, THETA Price Analysis: 26 June

The global crypto-market cap had fallen to $1.3 trillion at press time, with the same noting a 9.4% decline over the last 24 hours. Monero’s price, for example, depreciated by almost 10%, even though at press time the coin was trading in the green. AAVE’s charts have pictured a downtrend for most of the month while finally, THETA, despite showing price recovery over the past few days, was down by 9%.
Monero [XMR]
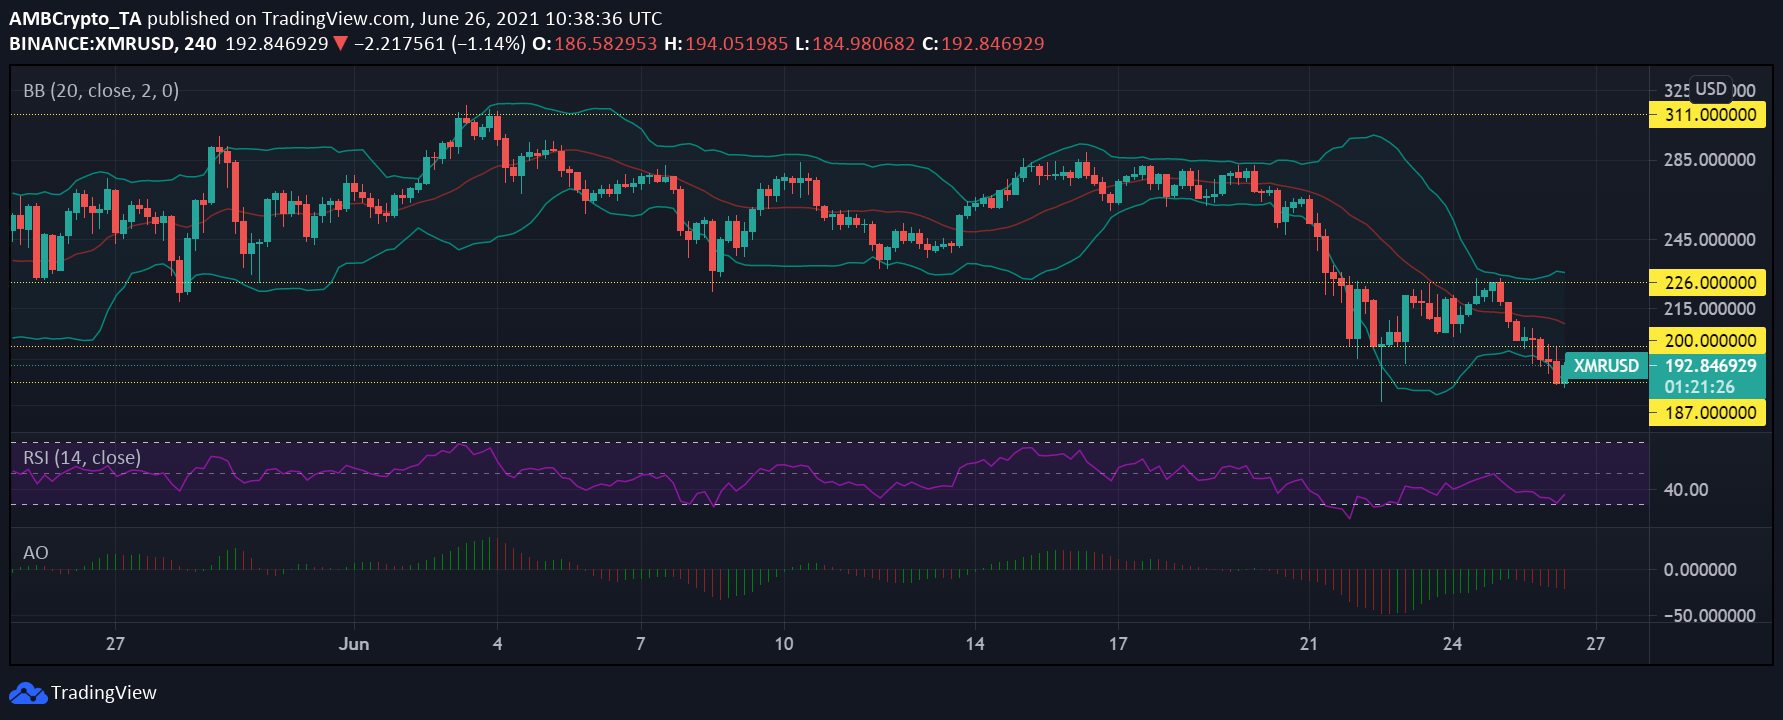
Monero was trading in the green at $192, at press time. However, it broke its support level of $200 just a day back and the alt’s volatility has been choppy lately. The coin’s price fell by 9.6% over the last 24 hours and it registered an almost 28% decline over the past week.
The coin has been on a downtrend since 4 June and even though the alt’s price had started to move away from the key support level of $200 just two days ago, the coin could not hold on to the northbound price movement.
The Bollinger Bands indicated that price volatility could increase over the next few trading sessions as the bands looked divergent at press time. Interestingly, the Relative Strength Index noted a tiny uptick away from the oversold mark, highlighting that selling pressure had decreased on 26 June. Of late, the altcoin market has seen a hike in the number of sellers, as compared to buyers.
On the Awesome Oscillator, a bearish signal could be found, with the alt being pictured moving in a bearish market.
AAVE
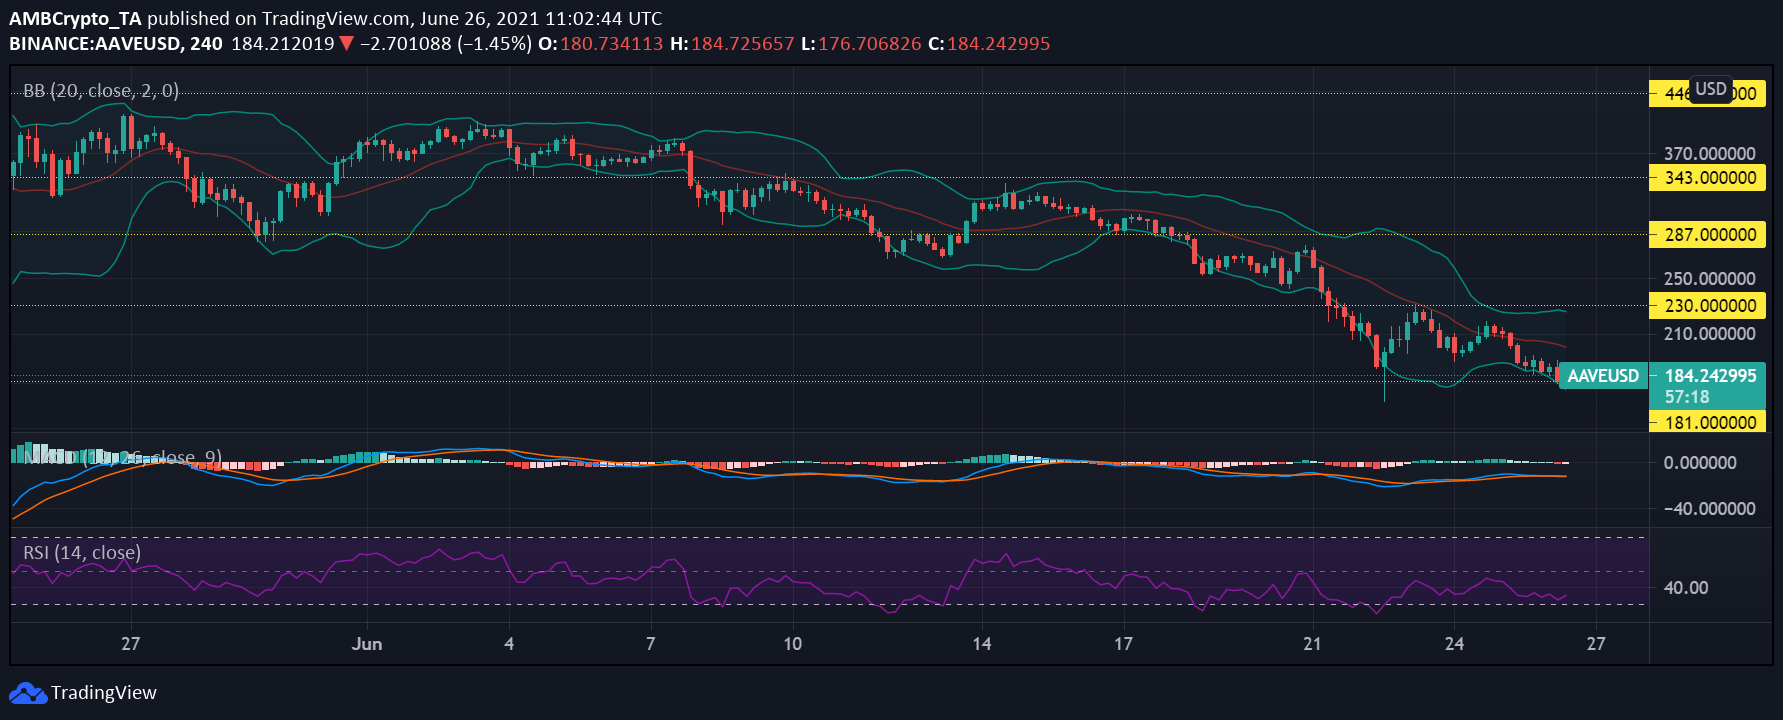
AAVE has pictured a sustained downtrend since 4 June and it has rarely shown any signs of recovery. In fact, after each brief price correction, the crypto saw it accounted for via a decline in price. A month back, the alt was priced at $416, with the same dropping by 54% since then. If in case there is a chance of an uptrend, the altcoin might find resistance at $230.
As far as fluctuations are concerned, the Bollinger Bands widened on the charts. The Relative Strength Index was pictured staying close to the oversold and undervalued zone. However, at the time of writing, the indicator noted a minuscule decrease in selling pressure.
The MACD and Signal lines were too close to each other and a clear indication of the trend couldn’t be found.
THETA
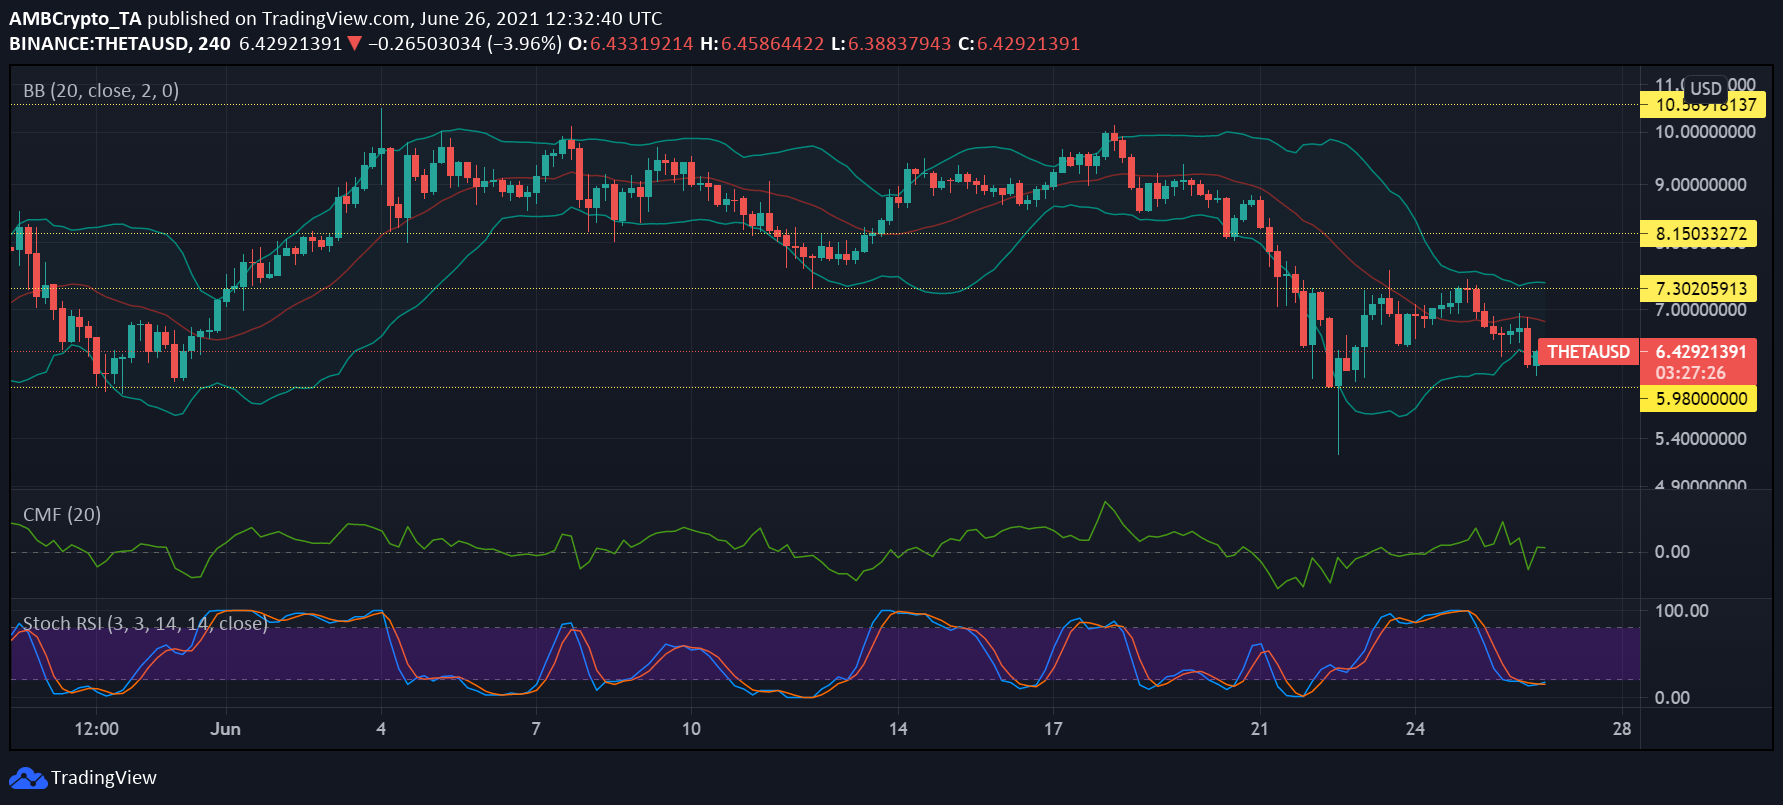
THETA fell by 7.7% over the last 24 hours. After a few days of consolidation between the $6.45 support and $7.25 resistance levels, the alt was pushed south. At press time, the Bollinger Bands opened up slightly and suggested that the price could fluctuate further. In case of a further drop in prices, the support level to watch for would be $5.98.
The Chaikin Money Flow on the 4-hour trading chart found that the capital inflows had increased just a little bit. However, capital outflows were still quite considerable.
Finally, the Stochastic RSI observed that the crypto was moving with bearish momentum and that there was a bearish crossover in the early hours of 26 June. Since it was below 20, however, a pullback might be expected.


