Bitcoin, MATIC and THETA Price Analysis: June 27

Bitcoin after tumbling for the past couple of days made a 4.7% recovery in the last 24 hours. Despite falling through key support levels, most altcoins faced subsequent price corrections and were trading in green at press time. Matic on the contrary noted a slight decline in value and was trading in the red.
Bitcoin
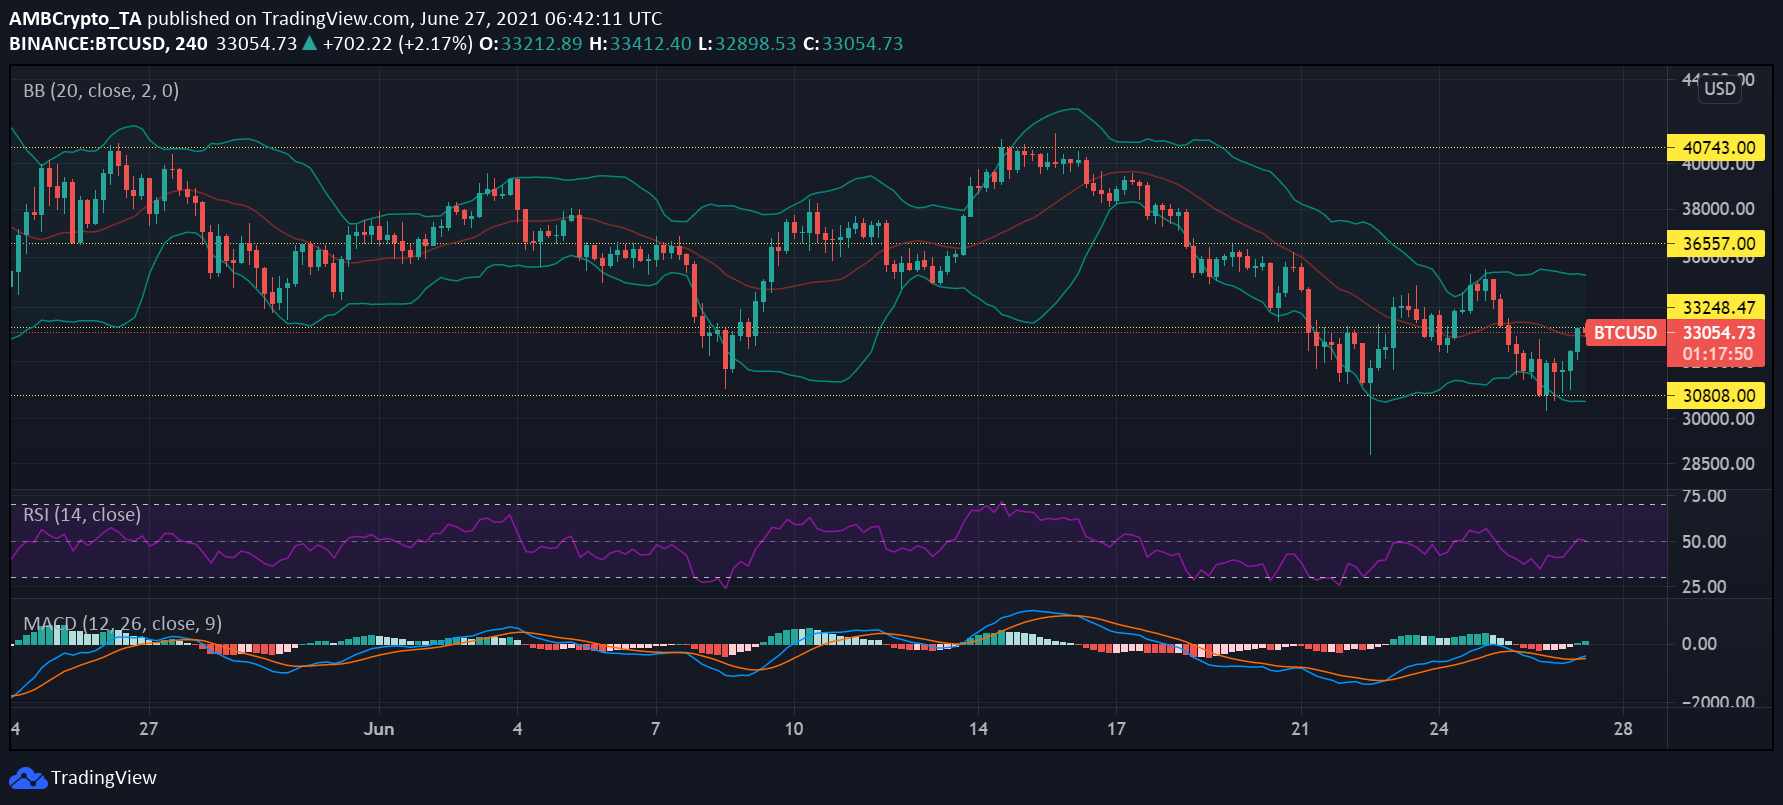
Bitcoin had tested some crucial support levels a couple of times in the month of June. On June 8, prices had dropped to the $33,000 mark similar to prices registered at press time. Bitcoin traded in red at $33,100 despite the recoveries it made over the past day.
Over the last few days, the king coin hovered near the oversold zone, however, that was not the case over the last 24 hours. Relative Strength Index moved north to the neutral zone, a move which signified that the market experienced an almost even number of buyers and sellers. Bollinger Bands remained parallel, which meant that prices won’t experience heavy fluctuations.
In case of a further drop, the coin could find support again at the $30,000 mark, and the next resistance to watch out for would be $36,500.
Finally, MACD showed a bullish crossover on June 27 with a beginning of a bullish signal at press time.
MATIC
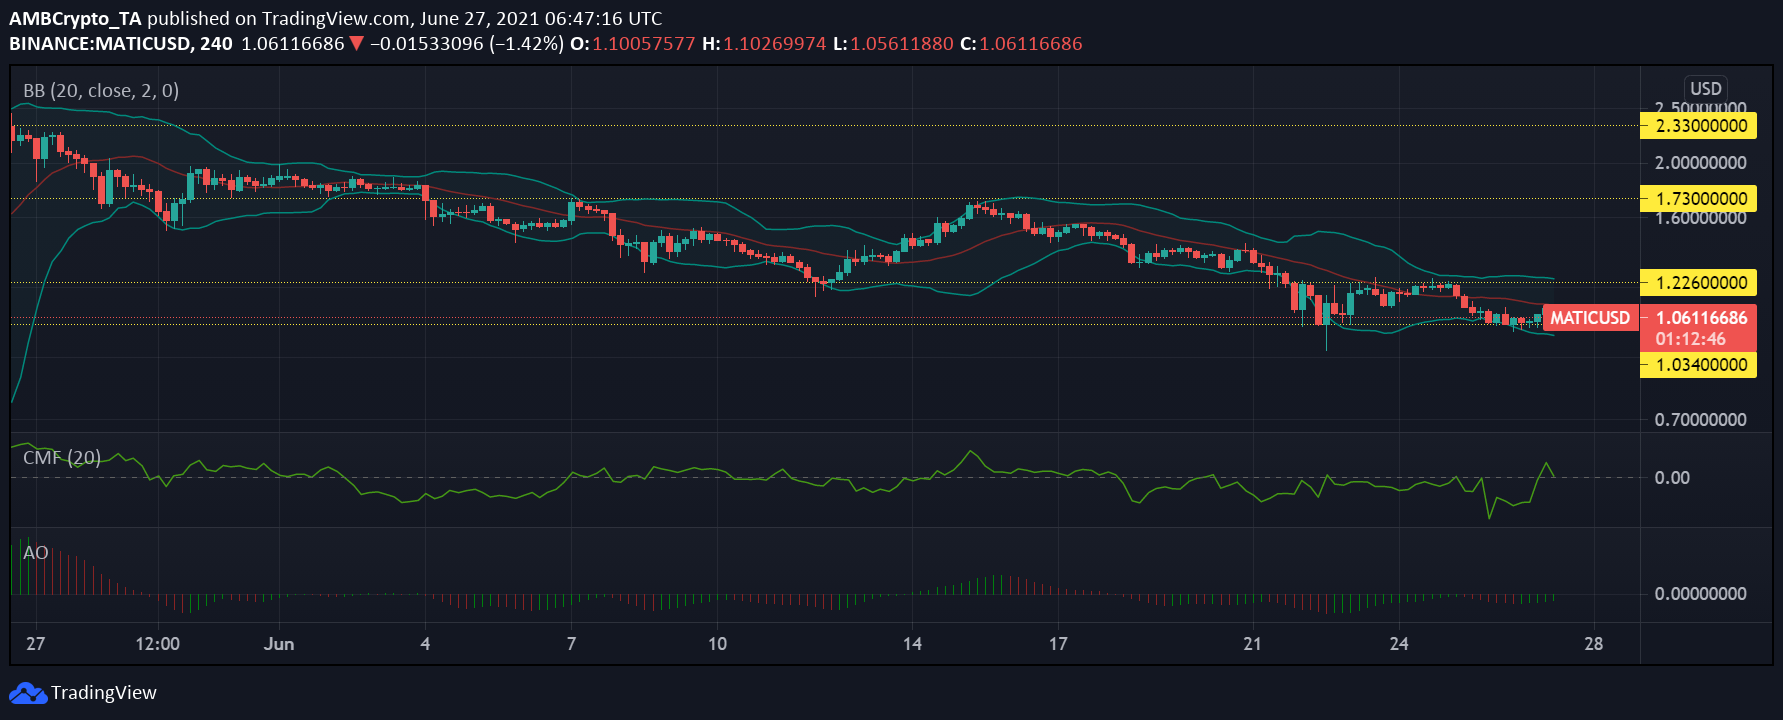
Matic was trading at $1.06 at press time, it recorded a decline in valuation by 21.8% over the last week. The coin underwent a brief recovery, but it started to fall in value after June 25. If Matic moves in an uptrend then it could witness resistance again at $1.22.
Bollinger Bands stayed parallel with slight convergence that indicated Matic might not witness a heavy price fluctuation over the next trading sessions.
The coin experienced a slight increase in capital inflows over the last day, however, at press time the coin noted a tiny decline in capital inflows as pictured on Chaikin Money Flow.
Awesome Oscillator displayed beginning of bullish momentum as the green bars were visible at the time of writing.
THETA
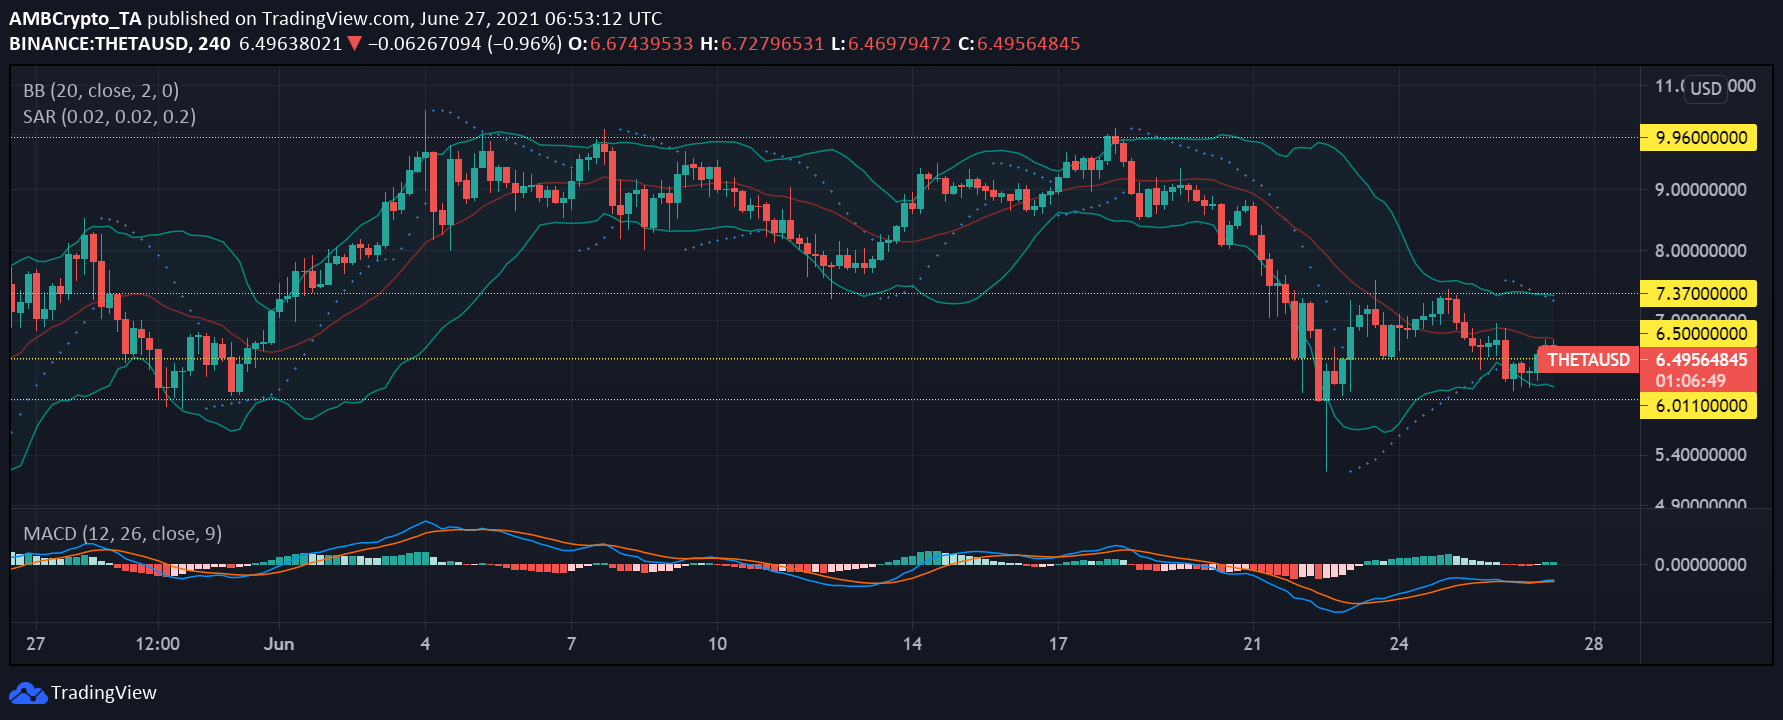
THETA fell below its key support level a few days back and had started to see recovery from that level; however, at press time the coin was trading in the red. At the time of writing, the coin started to go move up and if the momentum persists, the next resistance for the coin would be around $7.30.
Bollinger Bands showed some divergence which meant that prices could rise or fall slightly further on. Parabolic SAR depicted an uptrend since June 23 as prices were on the rise since then; however, over the last 24 hours the indicator pictured a downtrend, and at the time of writing the reading remained the same.
Finally, despite a downtrend in prices of the alt, MACD histograms displayed the start of bullish momentum and also read a bullish crossover at the early hours of June 27.


