Bitcoin, MATIC, Litecoin Price Analysis: 12 July

The global crypto market cap was $1.48 Trillion which increased by 3.1% over the last day. Bitcoin’s recovery was stable after last week’s dip in prices, MATIC struggled to break away from its support region however, as it traded too close to its crucial support level and Litecoin charts presented chances of a potential breakout.
Bitcoin (BTC)
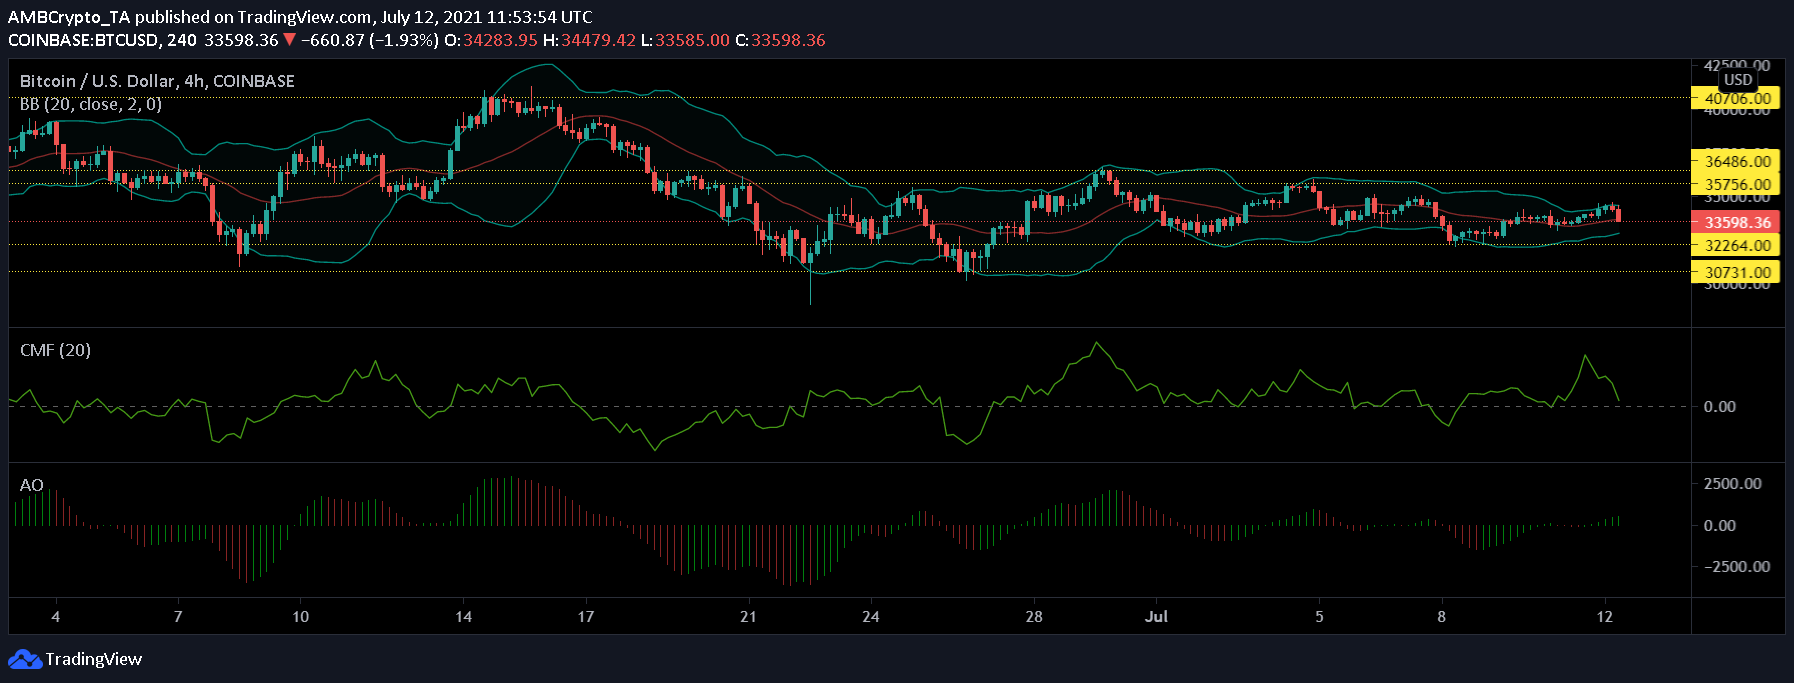
Bitcoin’s price was at $33549 at press time, having increased by 2.8% over the last 24 hours. It observed bullish signals as the technical charts affirmed the same. The king coin held its prices above the support level of $32,264 and showed signs of recovery after last week’s slump.
If the bulls continued pushing the prices upward, the coin may recover and test immediate resistance at $35,756. With regards to price movement and market volatility, Bollinger Bands had converged at the time of writing, which indicated that price volatility may remain low over the next trading sessions.
Awesome Oscillator pictured a growing bullish momentum as green signal bars were visible on the indicator. Capital outflows preceded capital inflows as the Chaikin Money Flow noted a fall towards the median line.
Polygon (MATIC)
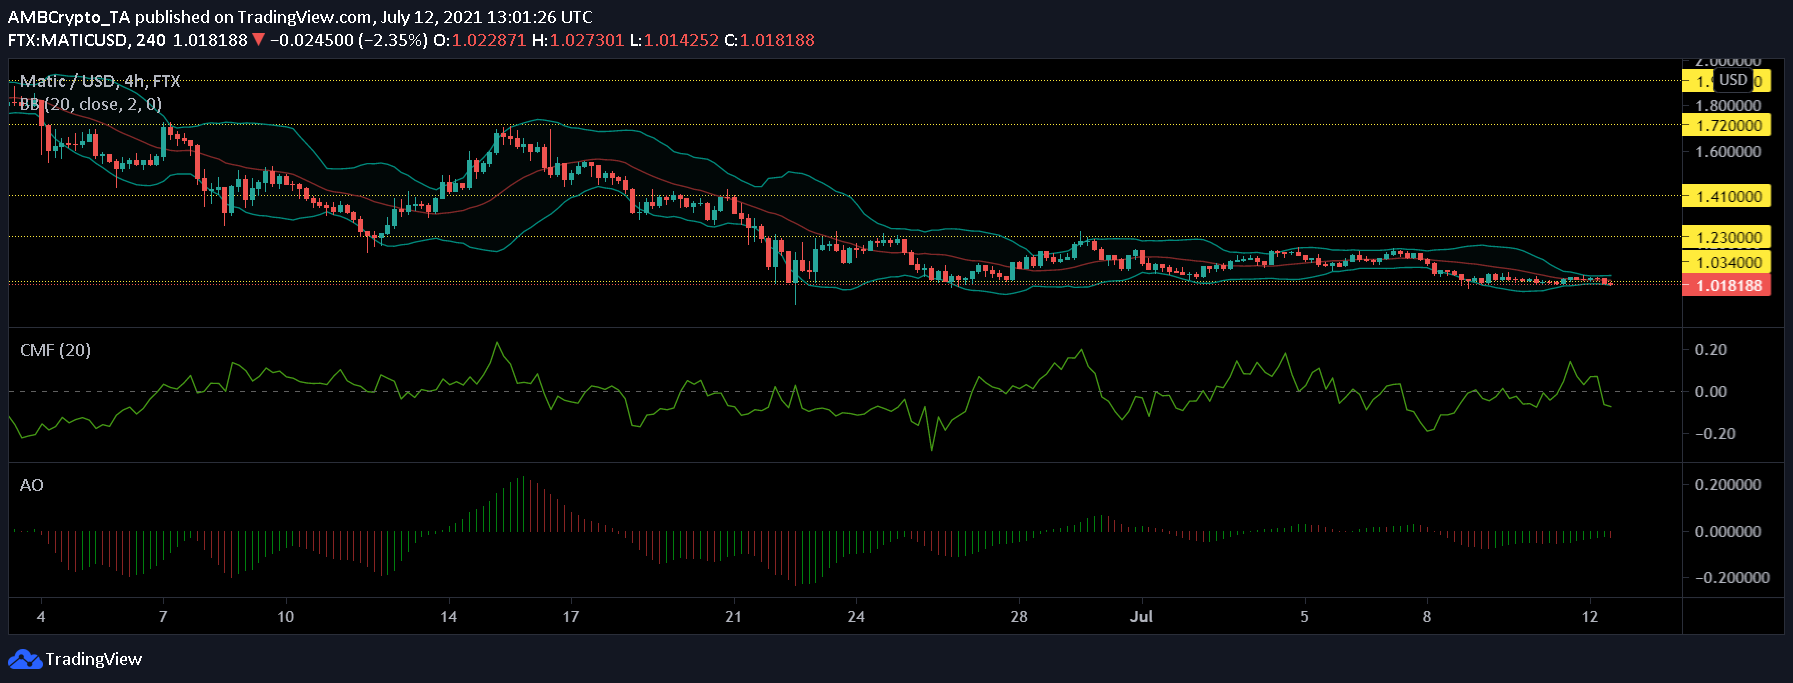
MATIC’s prices remained on the lower side, as it traded at $1.018 at press time, which almost marked a 62% fall in valuation from its all-time high. Overall, the assets prices have been exhibiting a sharp downtrend.
Following this, buying pressure in the market also fell and in correspondence to that, capital outflows exceeded as seen on the Chaikin Money Flow indicator.
Bollinger Bands indicated a sharp squeeze which meant that a price breakout was possible over upcoming trading sessions. Awesome Oscillator observed short-term bullish signal, however, at press time a red signal bar emerged to mark the decline of the bullish signal.
Litecoin (LTC)
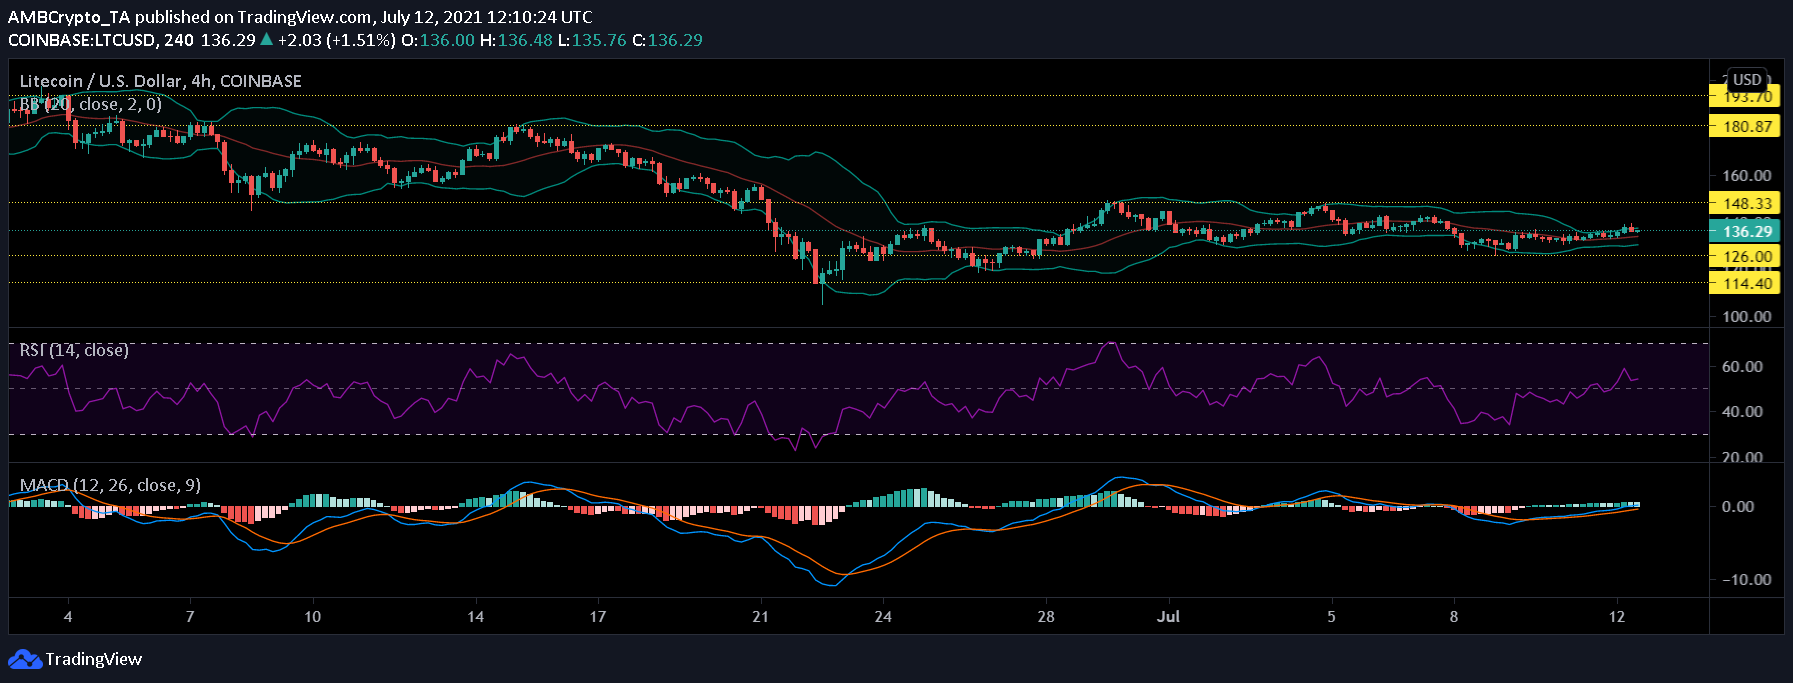
Litecoin, despite consolidation, commenced an upward movement as it crossed above the crucial support level of $126. At the time of writing the coin was priced at $136.29. Having oscillated between $126 and $148 for a while, if the coin were to venture into a continued uptrend, it can expect resistance at the $148 level.
Buying pressure increased as Relative Strength Index demonstrated a northbound movement, indicating that buyers preceded sellers in the market. Bollinger Bands tightened which meant that a price breakout could be on the charts for the coin.
MACD histograms depicted a short term bullish momentum, however, at the time of writing, the momentum seemed to be growing. The coin had witnessed a bullish crossover on July 9.

![Venice Token [VVV] likely to continue its long-term uptrend, supported by...](https://ambcrypto.com/wp-content/uploads/2026/07/Editors-1-e1784437616514.png)