Litecoin, Cosmos, Aave Price Analysis: 11 July

Litecoin’s price movement saw no change over the last 24 hours, but an observation of the charts revealed the alt remained within the trendless price movement zone. Trading volumes for LTC fell by 18.47% over the same period while in the case of ATOM, capital inflows grew. Finally, Aave, despite impressive recovery at the end of June, could not hold on to it as bearish pressure mounted at the time of writing.
Litecoin [LTC]
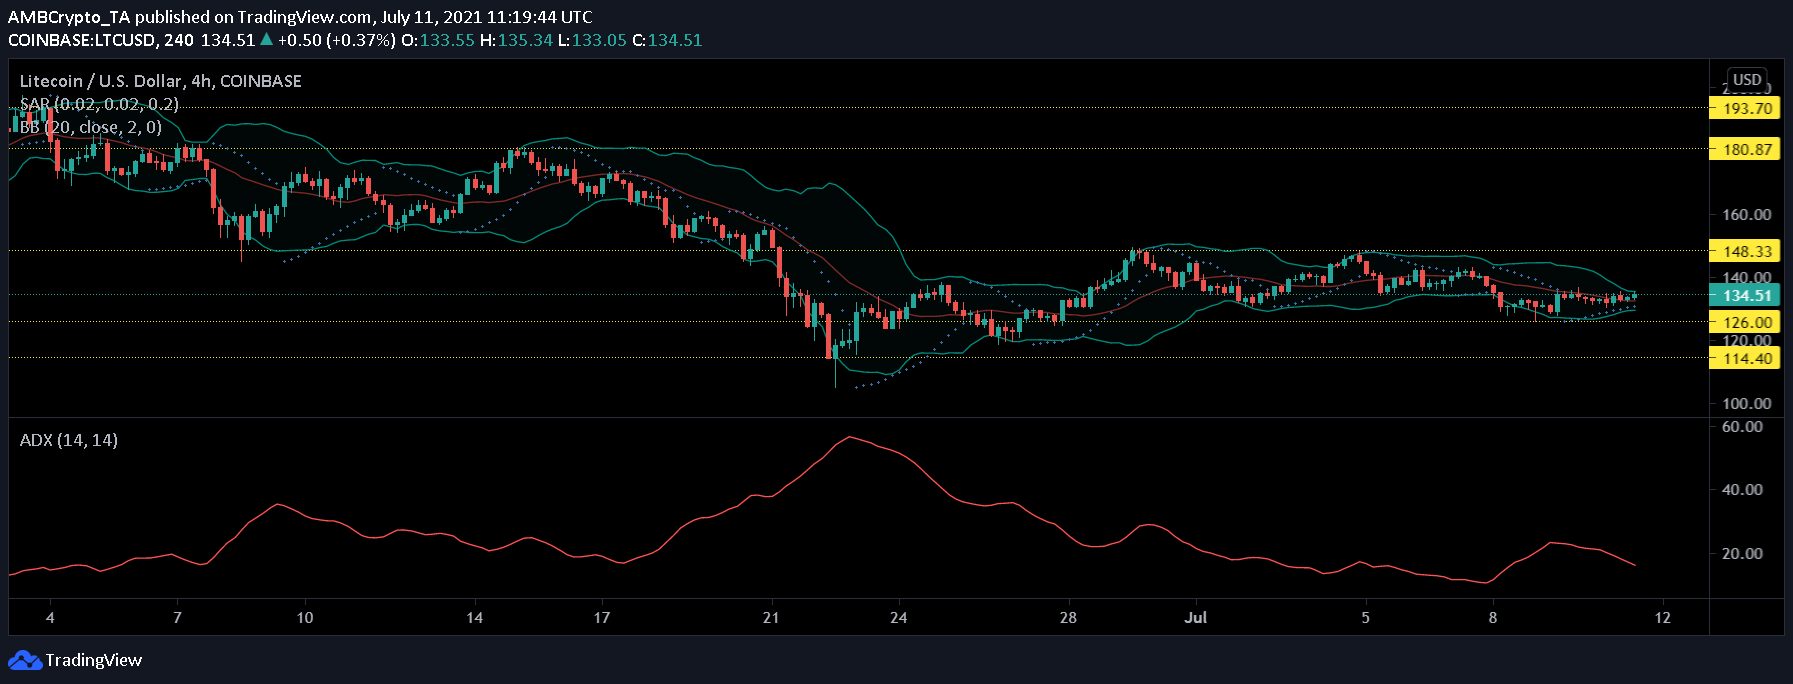
At the time of writing, LTC’s price was $134.5, a minor 1% increase from the previous day’s price. After choppy volatility within a constricted price range, the alt registered an uptrend. The Parabolic SAR’s dotted markers were arranged underneath the candlesticks, with this reading corresponding to the said hike. In case the price is pushed further up, the resistance level which the alt would test immediately would be $148.
In light of the fact that there’s quite the possibility LTC might move in a descending trendline, the token would find the $114 support level. The chances of market volatility remained low, however, as the Bollinger Bands were closing in at press time.
The Average Directional Index remained below the 20-mark which meant that the digital asset was inside a trendless price action zone.
Cosmos [ATOM]
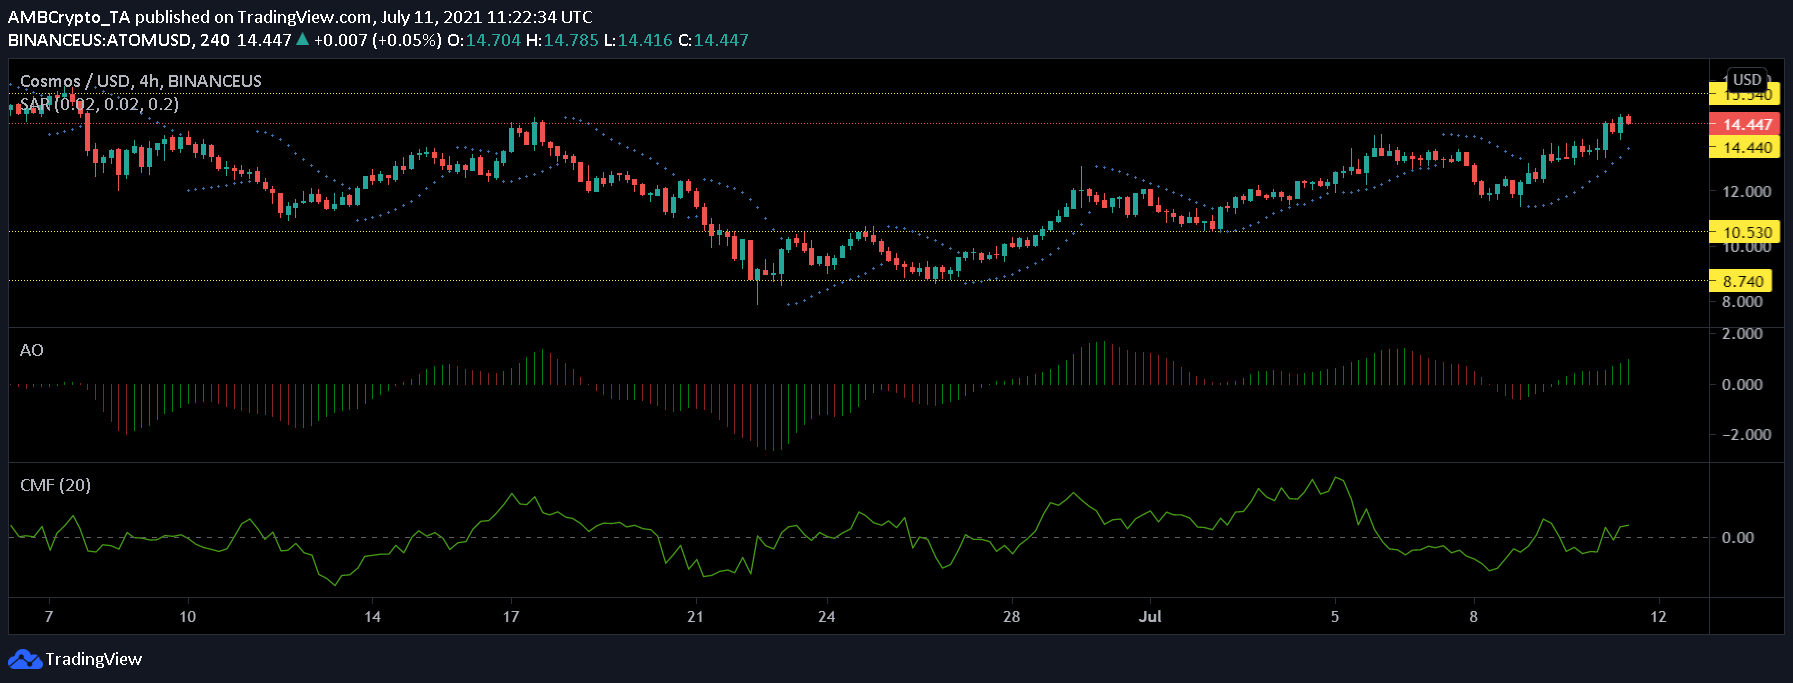
Unlike most major altcoins, ATOM actually registered northbound movement on the four-hour technical analysis charts. The altcoin was trading at $14.44 after noting a 7% hike in price over the last 24 hours. The market capitalization of ATOM also increased by 6.78%, at the time of writing. This uptrend could propel it to touch the resistance level of $15.54.
The Awesome Oscillator pictured growing bullish signals as the indicator noted the dominant presence of green signal bars. Capital inflows also increased as Chaikin Money Flow pictured a slight rise in the same at press time.
The Parabolic SAR reaffirmed the uptrend of the digital asset as the dotted markers were found below the candlesticks.
Aave
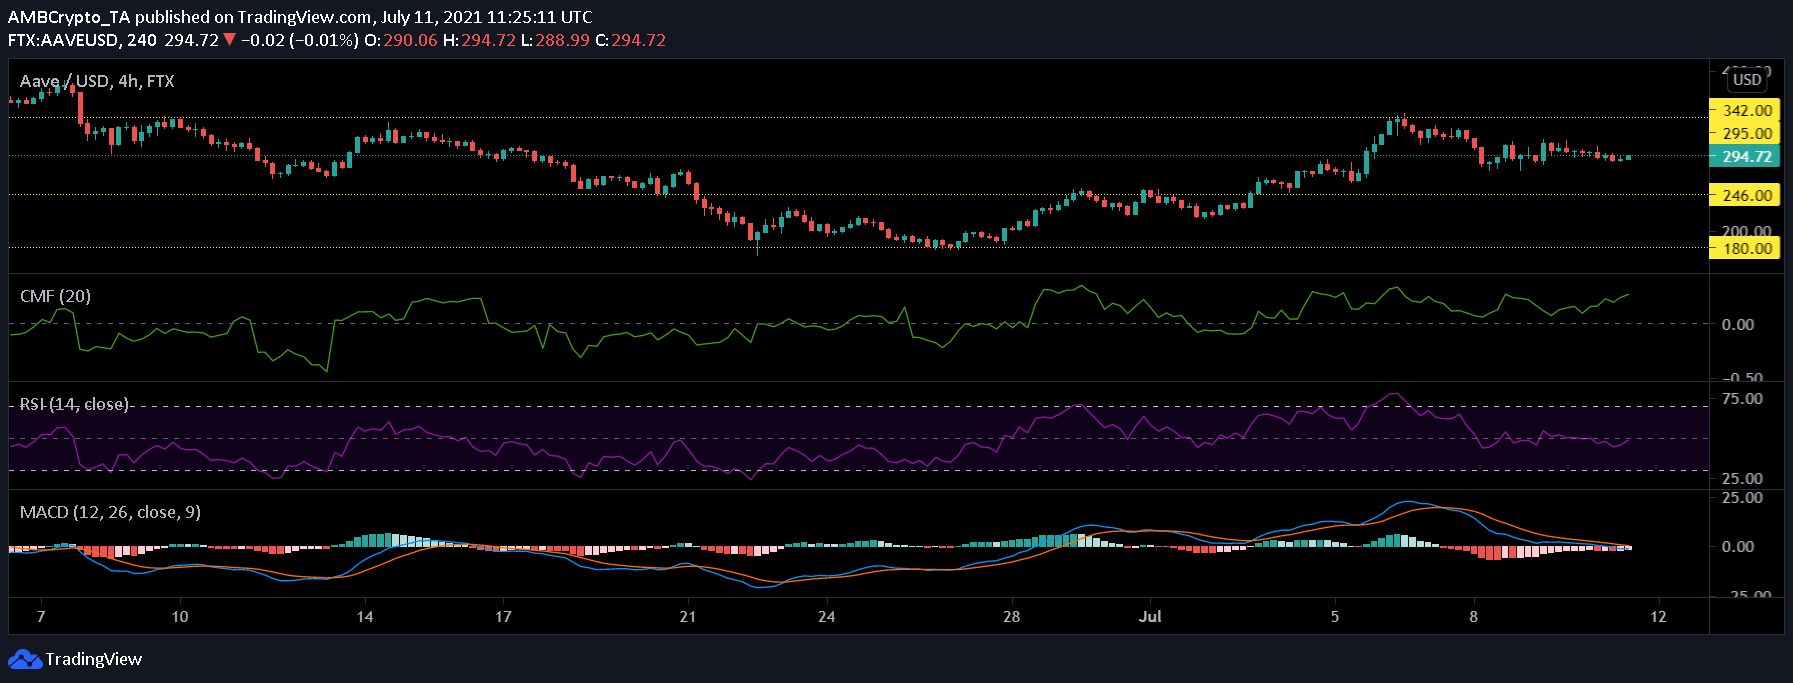
Aave’s recovery has been significant since 28 June. At the time of writing, Aave was priced at $294 after it fell by 3.2% over the last few days. Following the same, demand for the DeFi token also fell. At press time, however, the Relative Strength Index was seeing a slight increase in buying pressure.
Capital inflows exceeded capital outflows on the Chaikin Money Flow. What’s more, since the 7 July bearish crossover, the MACD’s histogram has portrayed growing bearish pressure in the market, meaning the price would not hike just immediately.
With bearish pressure mounting, the alt could find itself resting on or near the $246 support level. In what is a recent development, Aave is all set to launch its KYC-enabled DeFi for institutions via Aave Pro this month.


