Bitcoin, Polkadot and Matic Price Analysis: 4 July

After a period of recovery, major altcoins were back to trading sideways between their current support and resistance levels. Bitcoin’s price increased by 11% over the past week, followed by an increase in market cap and trading volume in the last 24 hours. DOT’s current prices have pushed the market into the overbought zone and MATIC witnessed modest selling pressure at press time.
Bitcoin
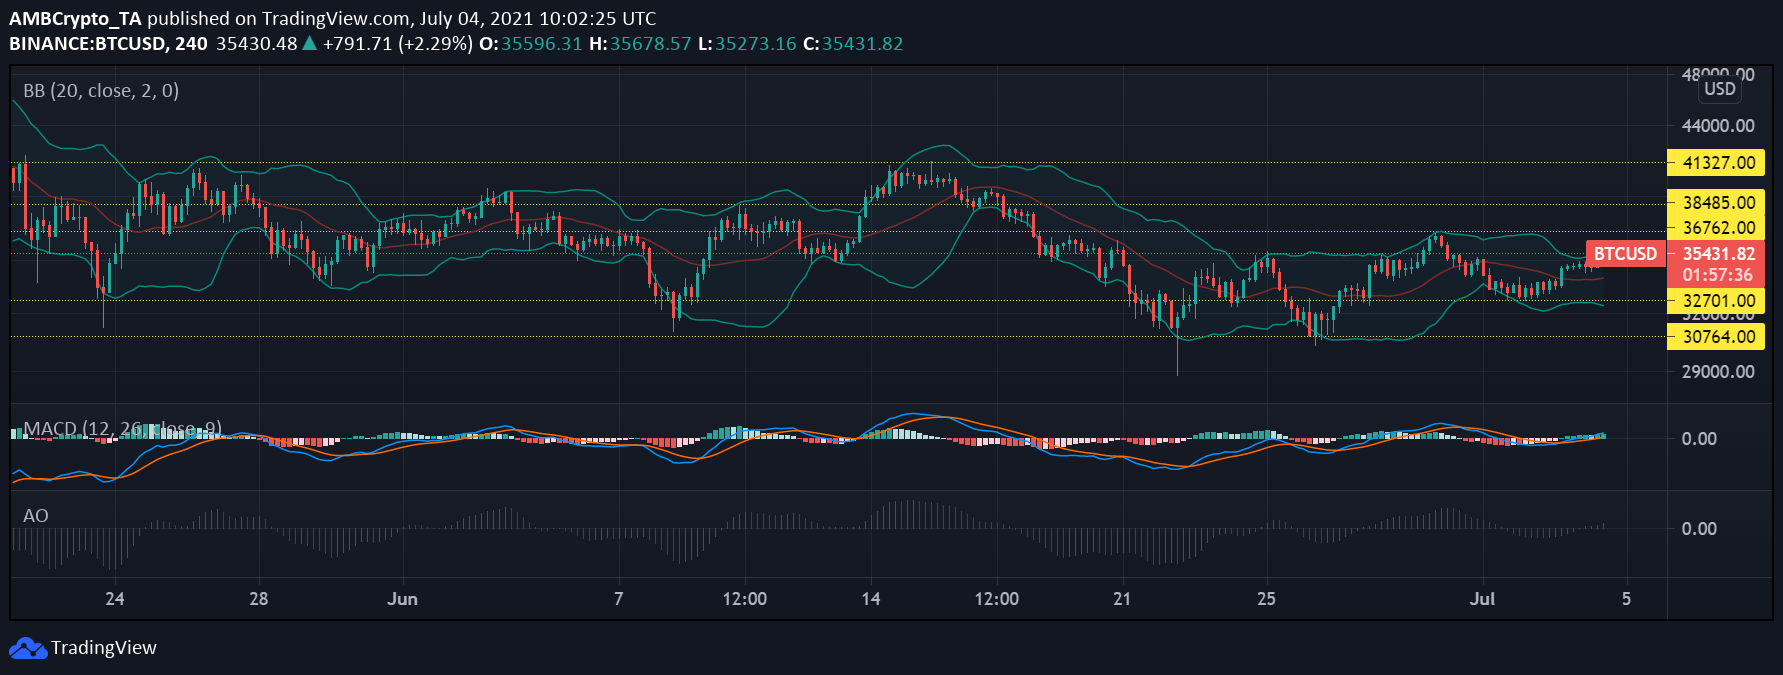
Bitcoin was priced at $35,431 with a market dominance of 45.49% at press time, the king coin’s prices increased by 5.2% over the last day. Despite daily gains, the coin is still to break above the $36,700 resistance level. At the current price level, immediate support and resistance levels are $32,700 and $36,700.
In correspondence to market volatility, Bollinger Bands diverged a little at press time, hinting towards the weakening of the current price trend.
As the price was on a moderate uptrend, the bulls could be seen pushing the prices further up as a bullish crossover was sighted on July 3 on MACD histograms, following which green bars appeared on the indicator.
Awesome Oscillator’s reading supported the aforementioned statement about a short-term bullish momentum as the green signal bars stood above the centerline at the time of writing.
Polkadot
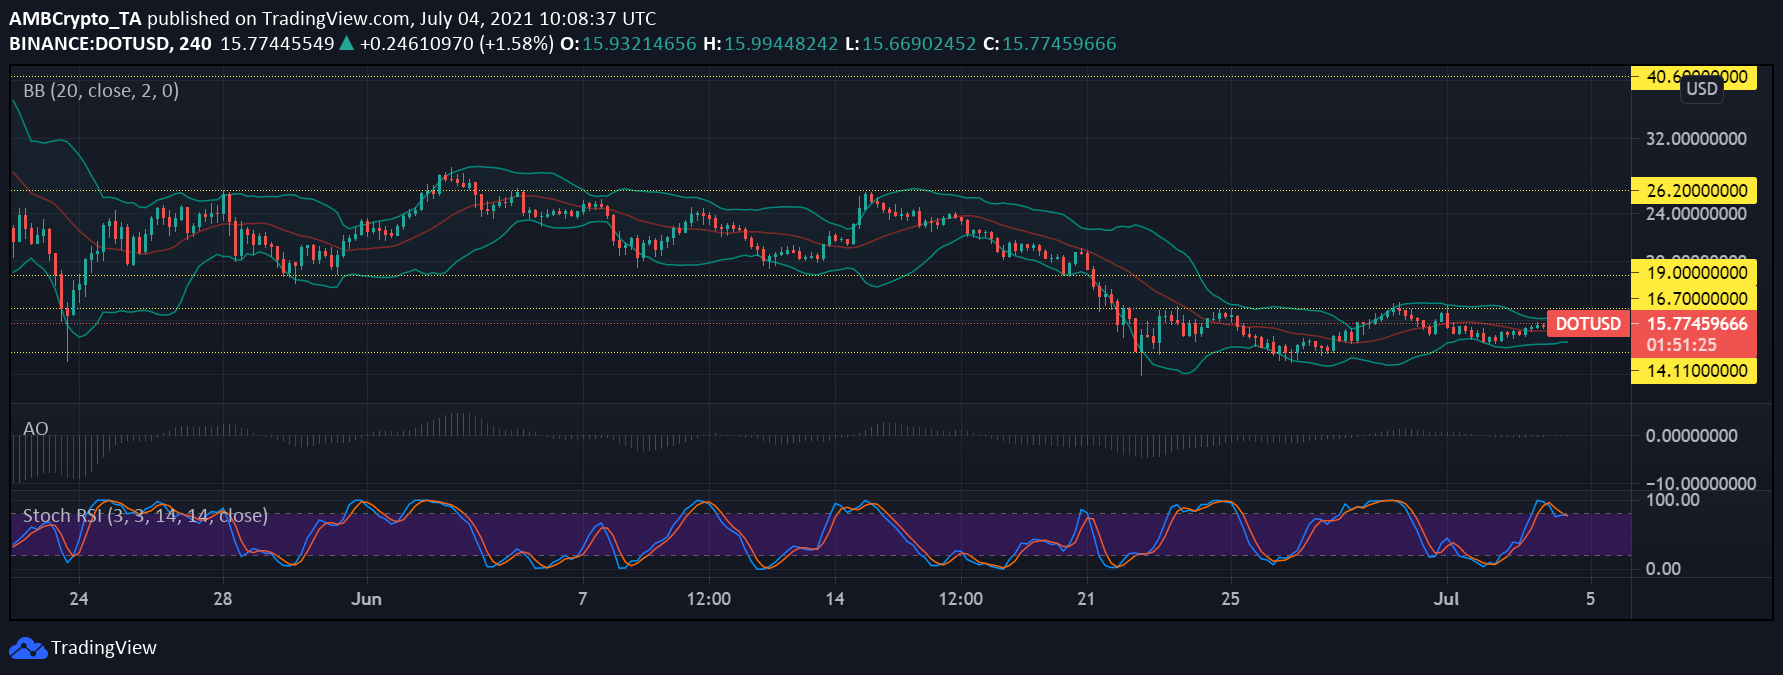
DOT has been trading sideways. Price levels remained sandwiched between $14.10 and $16.70. If the same price momentum continued, it could be possible for the coin to break below the $14.10 support level over the next trading sessions.
Over the last 24 hours, the coin’s prices were up by 5.1%; the digital asset was trading at $15.77 at press time. Traders seemed to be actively buying more of the alt as Stochastic RSI touched the 100-mark implying that the asset was overbought. Awesome Oscillator, at the time of writing, marked the buildup of bullish momentum as the green signal lines showed up on the indicator. Bollinger Bands narrowed further at the time of writing which suggested a period of low volatility for DOT.
Matic

Even though the coin has gained around 9% over the last seven days, the coin is yet to recover from the losses. MATIC’s market capitalization increased by 1.95% at press time, it was ranked the 17th largest cryptocurrency as per CoinGecko’s listing.
The dotted lines below the candlesticks as spotted on the Parabolic SAR highlighted the upward trend the coin embarked on. Bollinger Bands diverged for MATIC, meaning the coin would witness increased market volatility and steeper price action.
Relative Strength Index saw a small downtick at press time, underlying that sellers outnumbered buyers at that moment in the market.