Bitcoin Price Analysis: 19 March

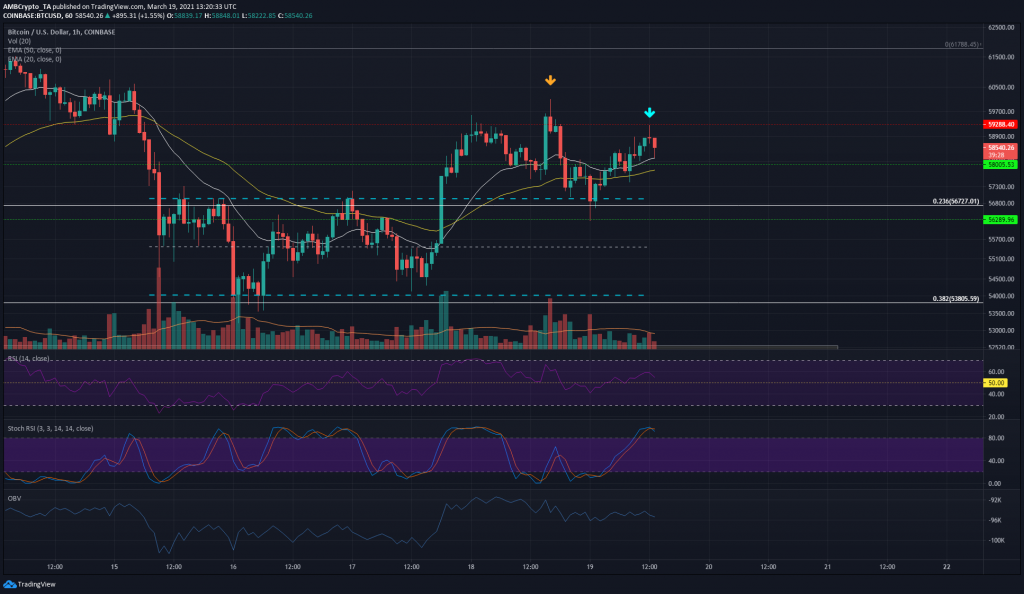
French economist Marion Laboure, macro-strategist at Deutsche bank, asserted that Bitcoin was now “too important to ignore“. True to that statement, in the short-term, the price climbed past $56,950 in the past 48 hours and retested $56,200 as support. The $59,300 level can pose some resistance to price, although the bullish momentum of the past few hours might be able to drive prices higher.
Bitcoin 1-hour chart:

Source: BTC/USD on TradingView
In the past 40 hours, BTC approached the $59,300 barrier thrice. On each of those occasions, BTC was rejected. Marked by the orange and cyan arrows are hourly trading sessions where the sentiment swung in favor of the selling side after encountering substantial resistance at $59,300.
The orange arrow shows buyers attempting to drive prices up (and failing) and sellers succeeding in closing the session lower. This was immediately after a strong bullish candle, and the bearish candle had greater trading volume as well, representing an intense skirmish between buyers and sellers.
The blue arrow shows a Doji candle formed as indecision mounded once more near the $59,300 mark. There were signs that BTC could test the $58,000 level as support in the coming hours.
Reasoning
OBV on lower timeframes showed that the recovery from $56,800 was driven by demand. However, there was a lack of strength from buyers above $59,000.The past couple of days have seen sellers step in at $59,000-$59,300 area. The entire area from $56,200 to $59,300 has seen OBV oscillate without seeing a spike either upward or downward, suggesting some equilibrium from buyers and sellers so far.
While RSI was above neutral 50 to signal bullish momentum, Stochastic RSI was in overbought territory. Its correction lower could see a dip for BTC. The 20-period EMA (white) was moving above 50-period EMA (yellow) to show bullish momentum, and the price could also find support at 50-period EMA.
Conclusion
Bitcoin broke out of the $54,000-$59,950 range in recent days and has also retested the $56,200 level as support. These developments hinted at recovery for BTC. The $58,000 and $56,200 levels of support should be defended over the next few days for Bitcoin to make another attempt at the $60,000 mark.


