Key metric suggests Bitcoin is about to cross a vital threshold

Bitcoin’s market cap, briefly, went past Tesla’s, as the cryptocurrency’s price surged to a new ATH of $41,940. Despite BTC falling at press time owing to a wave of corrections, bullish sentiments claim Bitcoin will be heading towards higher figures amid the U.S dollar’s weakness and growing institutional demand.
While some metrics anticipate a coming drop in prices, this could be temporary in the larger context. In fact, just recently, Glassnode revealed that Bitcoin’s Entity Adjusted Dormancy Flow reached a crucially bullish threshold.
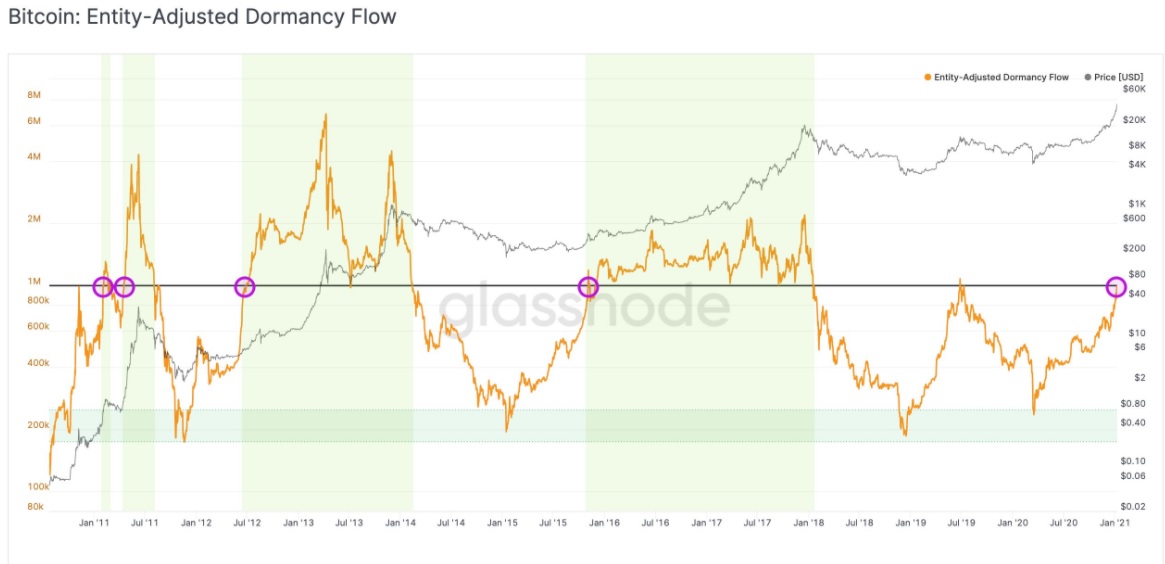
According to Glassnode and independent analyst David Puell,
“Entity-adjusted Dormancy Flow is the ratio of the current market capitalization and the annualized dormancy value (measured in USD). It can be used to time market lows and assess whether the bull market remains in relatively normal conditions. It helps confirm whether Bitcoin is in a bullish or bearish primary trend.
Dormancy integrates all these narratives into a single metric, by comparing both ratio components at all times, and displaying them in a simple oscillation by which, on a trending basis, high dormancy is bearish and low dormancy is bullish.”
Before the onset of the 2020 bull market, some investors were maintaining that the digital asset would rise above its old ATHs. At the time, anticipated price dips came true as some hodlers did indeed sell.
However, while current market trends have seen BTC double from $20K to $40K in a matter of weeks, users still don’t want to sell. This suggests that traders seem to be believing in BTC’s potential to reach higher numbers.
With regard to selling pressure in the market, Chainalysis says otherwise. According to the firm’s data, BTC inflows to exchanges in the last 24-hours were as high as 127.72k BTC, above the 180-day average. Additionally, Glassnode noted that BTC Exchange Inflows (1-day Moving Average) reached an ATH of $132,812,085.62.
However, any additional market supply into exchanges can be met by incoming demand. Tether’s inflows could also signal a build-up of buying pressure. In fact, according to Chainalysis, USDT inflows to exchanges over the last 24 hours were 1.18B USDT, also above the 180-day average.
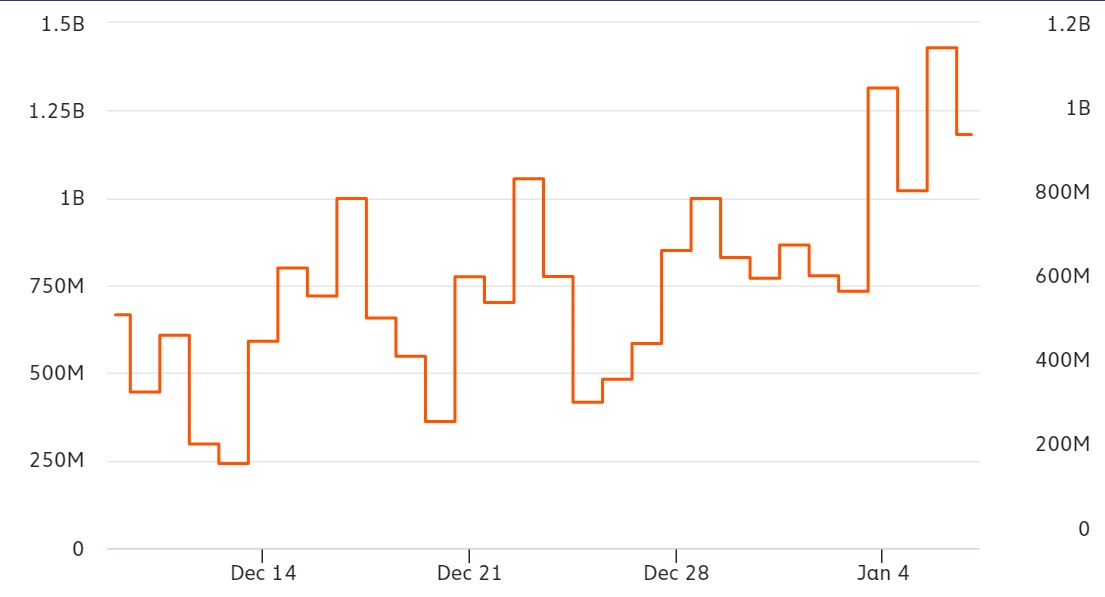
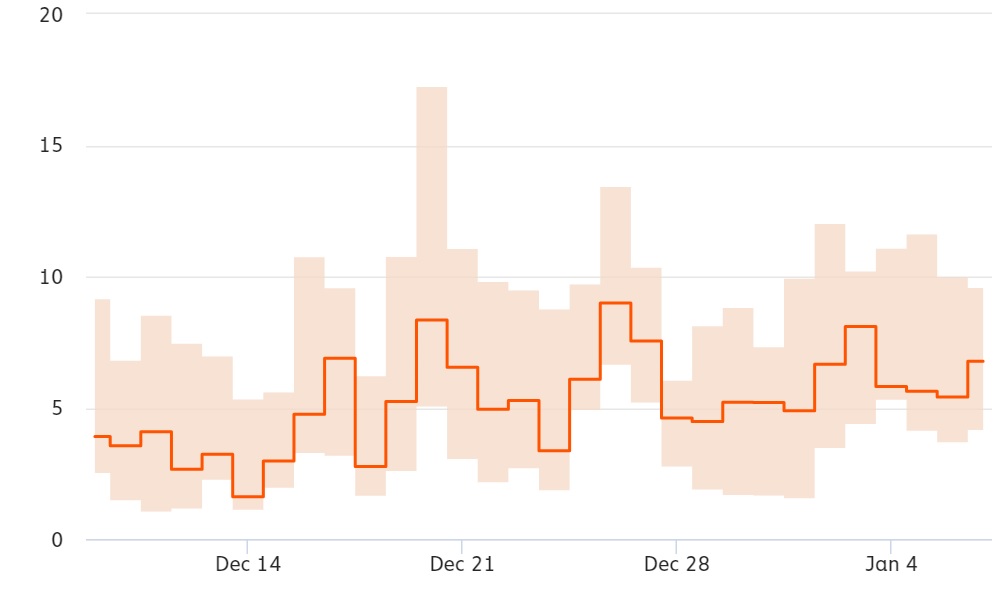
Moreover, increasing trade intensity suggests that more market participants want to buy than to sell. BTC median trade intensity over the same time period was 6.77, above the 180-day average, as seen in the image below,
Further, earlier today, Glassnode also recorded a new ATH of active Bitcoin addresses on the chain. The last time these addresses recorded such highs was back in late-2016/early-2017, at a time when the Bitcoin bull market began.
Finally, even Skew revealed that Open Interest on Bitcoin Options climbed over $10 billion on various exchanges, including the CME. Also, new data found that increased perception of Bitcoin as a store of value and hodling activity was reducing liquid Bitcoin. In fact, analysts have been saying that an increase in illiquid Bitcoin would increase scarcity, thus painting a “potentially bullish picture for Bitcoin” in the next few months.