Can Polkadot solely rely on its development activity for a bullish November

Polkadot [DOT] has been in the spot light for quite some time now owing to its high development activity. DOT made headlines once more for the same reason, as it ranked second among crypto projects in terms of development activity in the last 30 days, only behind Cardano [ADA].
⚡️Top #Crypto Projects by Developer Activity in October
31 October 2022 $ADA $DOT $KSM $ATOM $MANA $FIL #Ethereum $ETH #ETH $EGLD #EGLD $FLOW $APT pic.twitter.com/uFIZ6ov8GK— CryptoDep (@Crypto_Dep) October 31, 2022
_____________________________________________________________________________________
Here’s AMBCrypto’s Price Prediction for Polkadot [DOT] for 2023-24
_____________________________________________________________________________________
Not only that, but according to Stakingrewards, DOT also witnessed growth in terms of Total Value Locked (TVL). DOT’s TVL registered a more than 13% increase as of 31 October, which was positive news for the network.
⚡️Top Projects by Total Staked Value
31 October 2022#Ethereum $ETH #ETH $SOL $ADA #BNBChain $BNB #BNB #Avalanche $AVAX #AVAX $DOT $MATIC $ATOM #TRON $TRX #TRX $ICP $ALGO $NEAR $FLOW $CAKE $XTZ #XTZ pic.twitter.com/C7HBcNtNuj— CryptoDep (@Crypto_Dep) October 31, 2022
Interestingly, Polkadot’s performance on its chart also looked quite promising as it registered nearly 12% weekly gains. This was due to the current bullish market. Furthermore, at the time of writing, DOT was trading at $6.62, with a market capitalization of over $7.49 billion. However, will these new developments be enough to sustain this pump in November?
Should investors be worried?
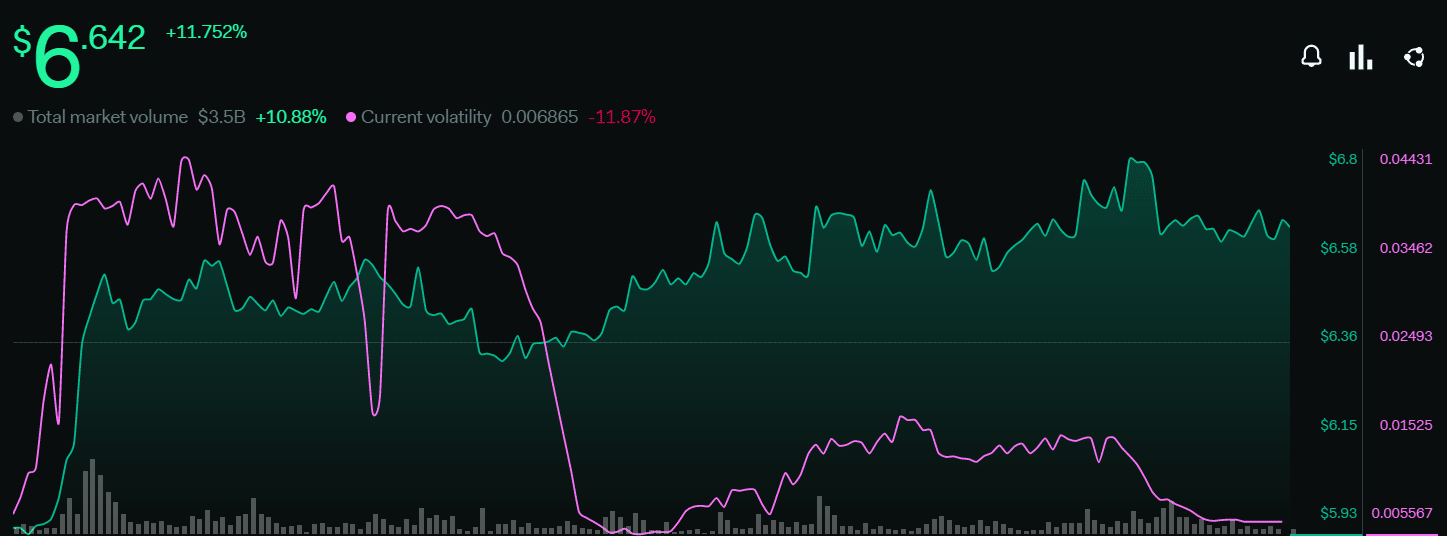
Despite performing well over last week, things may witness some changes, as at press time, DOT was already down by nearly 1% in the last 24 hours. Furthermore, several on-chain metrics revealed the possibility of a trend reversal in the days to come. LunarCrush’s data revealed that DOT’s volatility registered a decline over the last few days. This was a bearish signal as it minimizes the chances of a northbound movement.
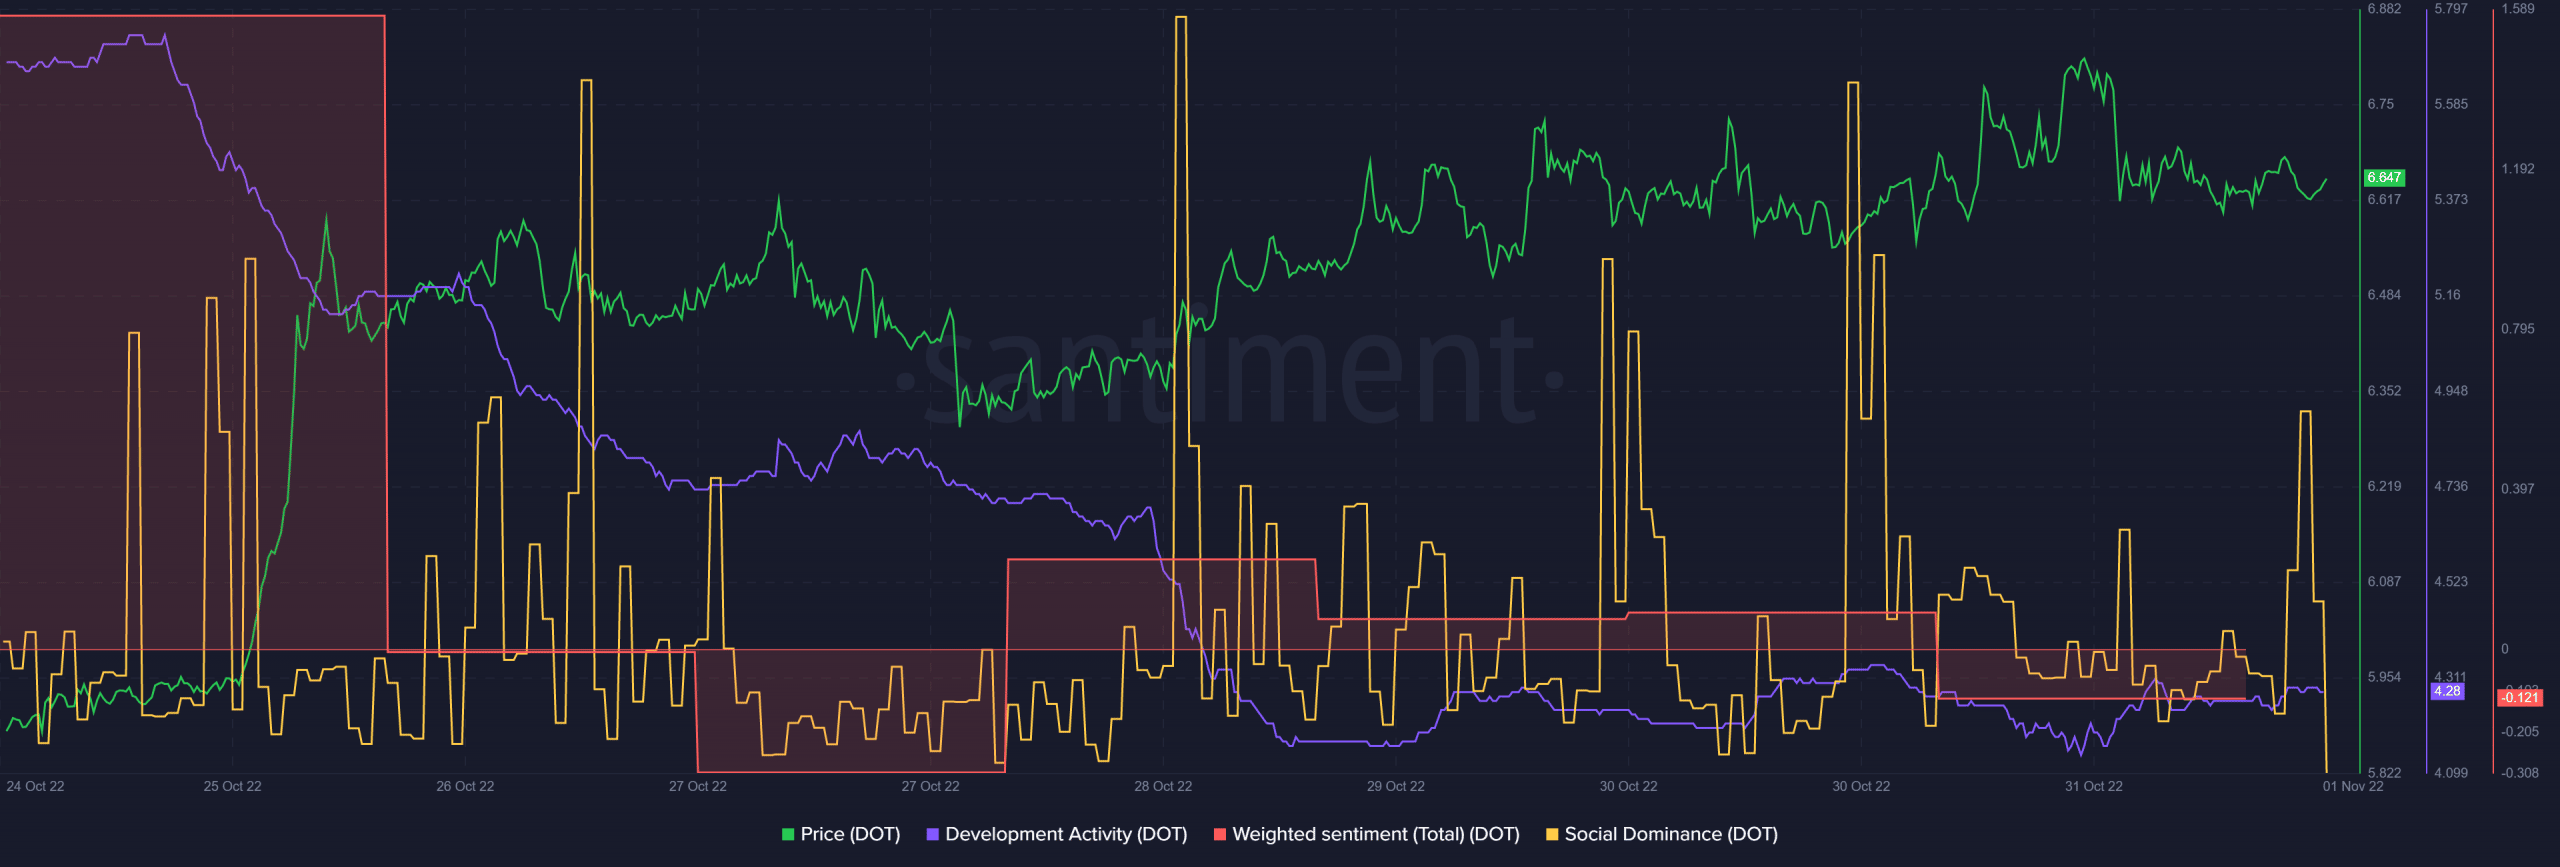
Interestingly, despite being one of the top cryptocurrencies in terms of development activity, DOT development activity took the opposite route and decreased considerably. DOT’s popularity also seemed to have been affected last week as its social dominance and weighted sentiments went down lately. This was a red flag for Polkadot.
This gives hope
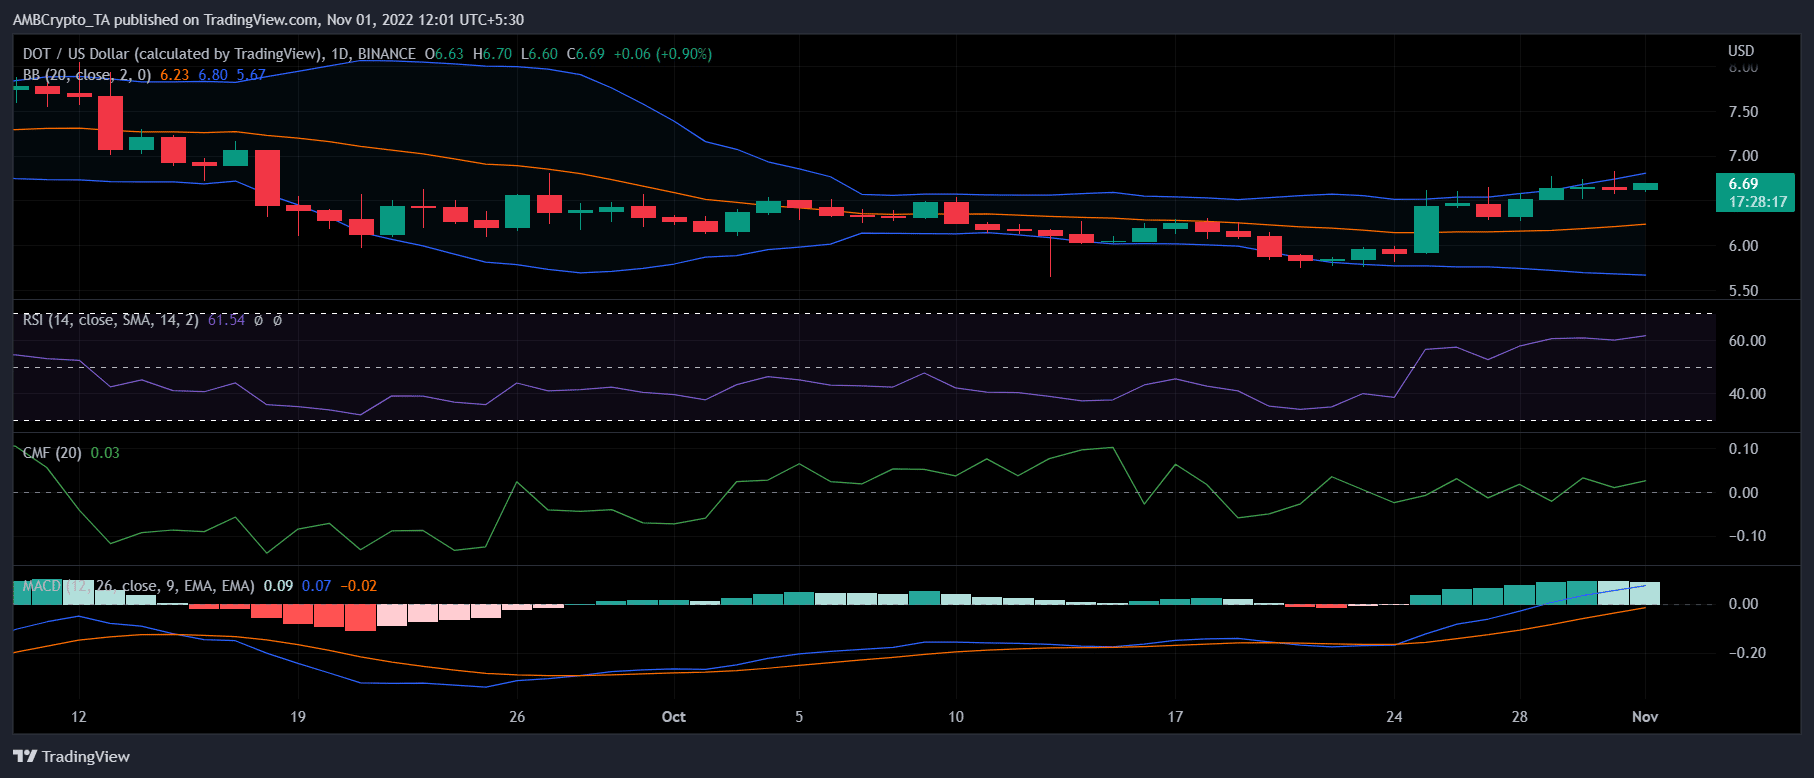
However, DOT’s daily chart was pretty bullish and gave investors hope as it suggested a continued price surge in this new month. The Moving Average Convergence Divergence (MACD) revealed a buyers’ advantage in the market. The Relative Strength Index (RSI) complemented MACD’s finding as it registered an uptick. It also stood well above the neutral position.
Though the Chaikin Money Flow (CMF) was near the neutral area, it marked a slight uptick, which was bullish. The Bollinger Bands (BB) suggested that DOT’s price was about to enter a high volatility zone, further increasing the chances of a price hike.