Cardano saw a trend of falling trade volume that showed a market possibly in a phase of distribution. However, in this bull market, another leg upward can not be discounted. Bitcoin SV formed a bearish divergence and Compound saw demand rise at the $440 area.
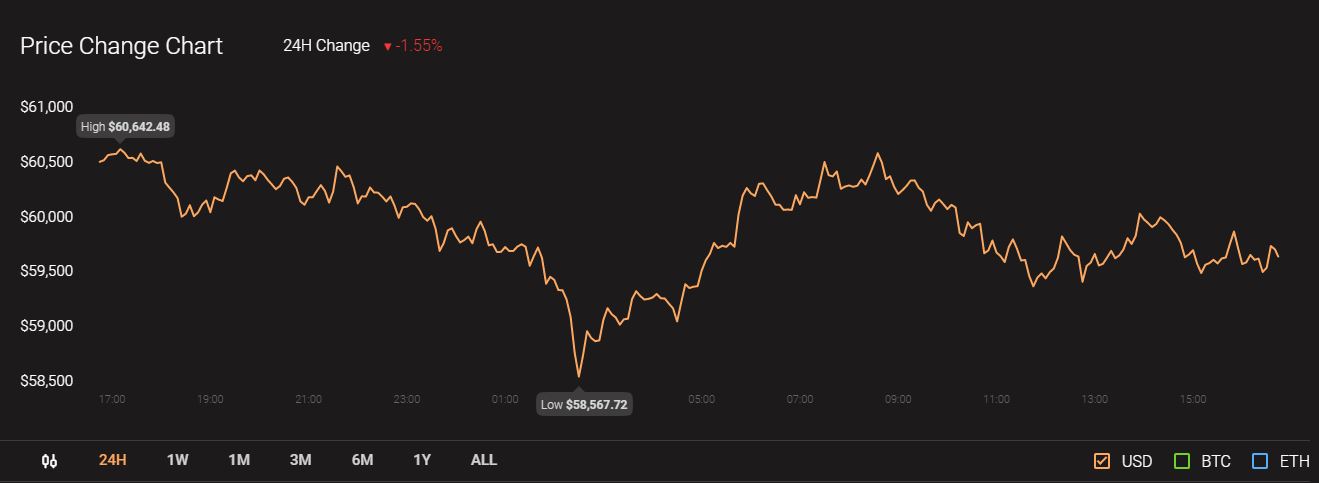
Source: CoinStats
At the time of writing Bitcoin was trading at $59,656 with a marginal drop of over 1.5 percent in the past day’s time.
Cardano [ADA]
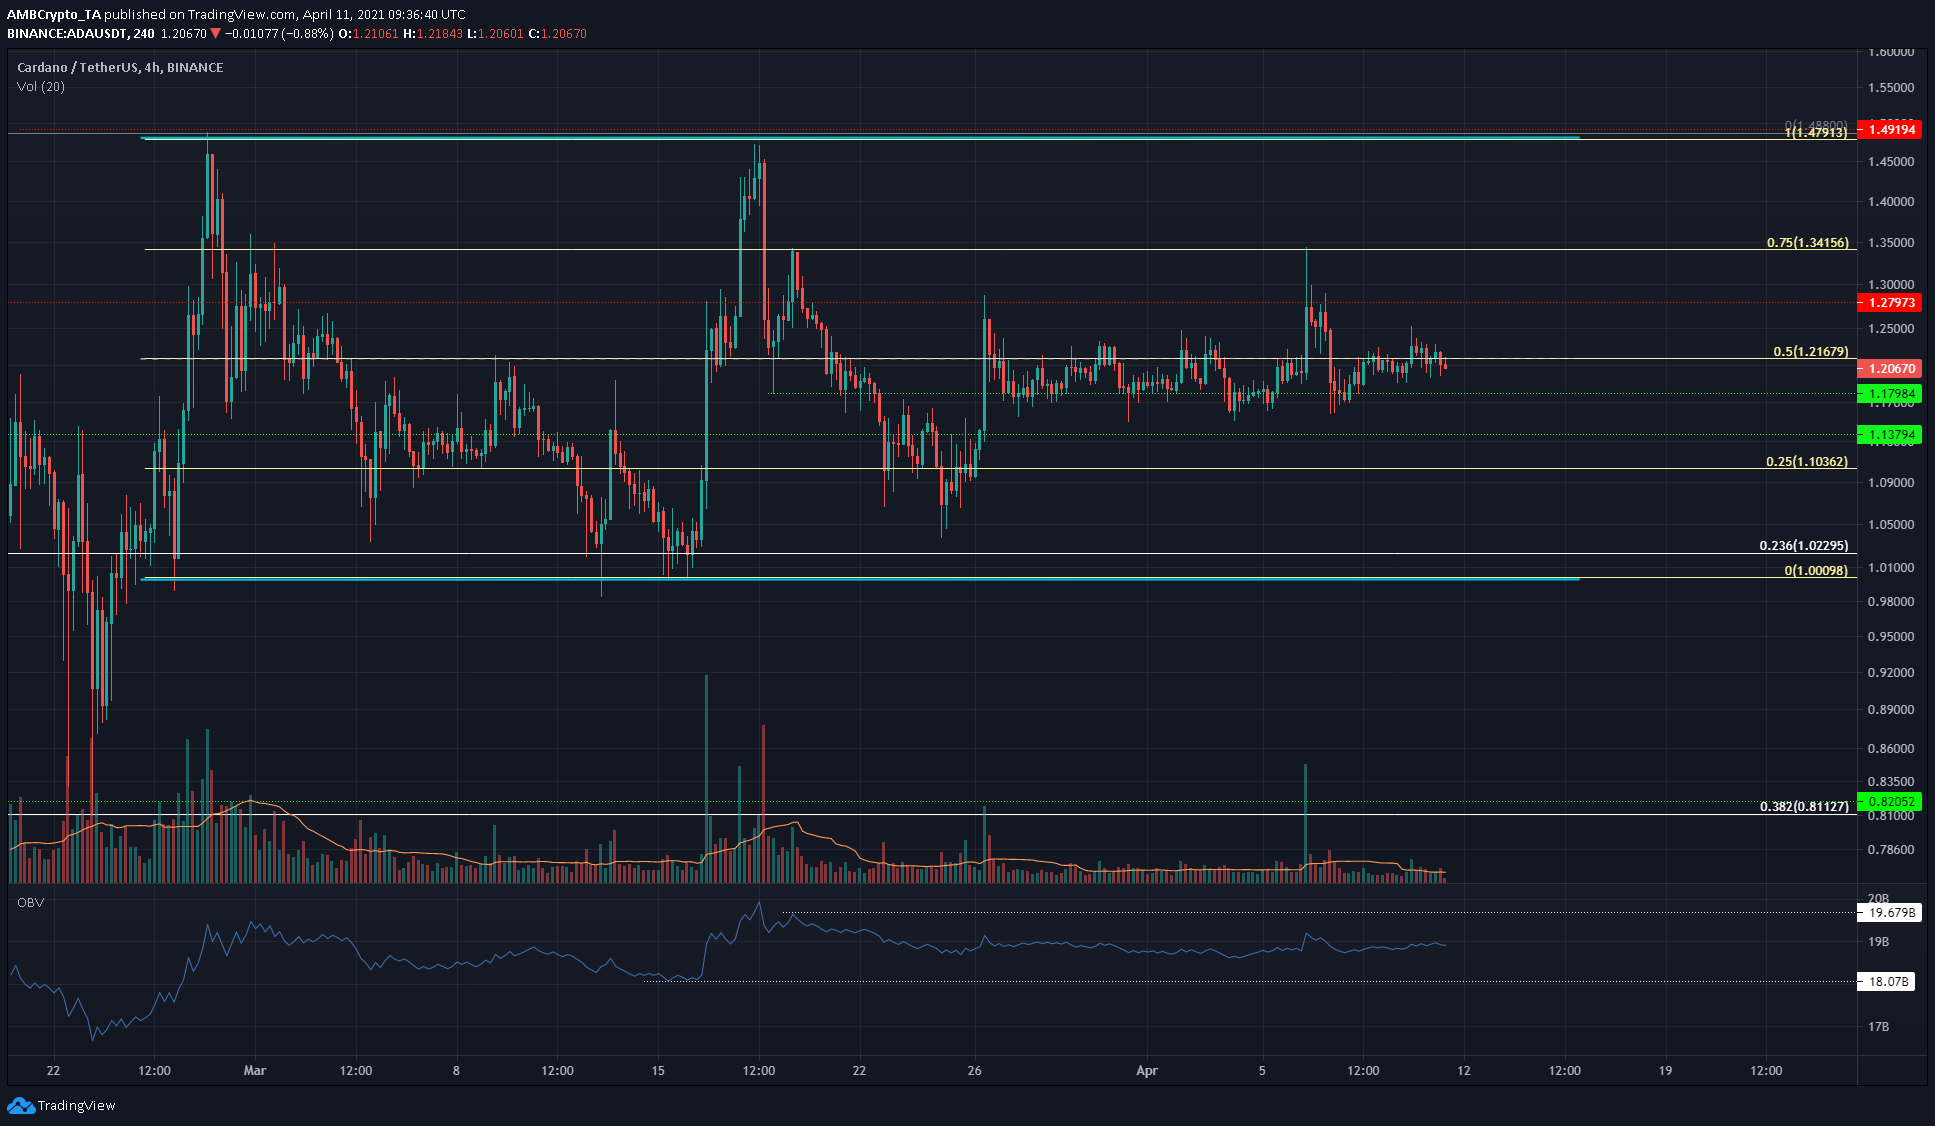
Source: ADA/USDT on TradingView
Cardano showed a lack of movement in price on the charts over the past few weeks. The range from $1 to $1.47 has its 50% mark at $1.21, and that is a strong level of resistance for the price. ADA has bounced between the $1.17 and $1.21 levels, and buyers and sellers are in equilibrium, according to the OBV.
There is an upper and lower boundary on the OBV that needs to be broken to confirm a move above $1.34, or below $1, in the weeks to come. However, this will take time to develop, and the $1.2-$1.3 area is likely to be a supply till the OBV starts ticking higher to show increased demand.
Bitcoin SV [BSV]
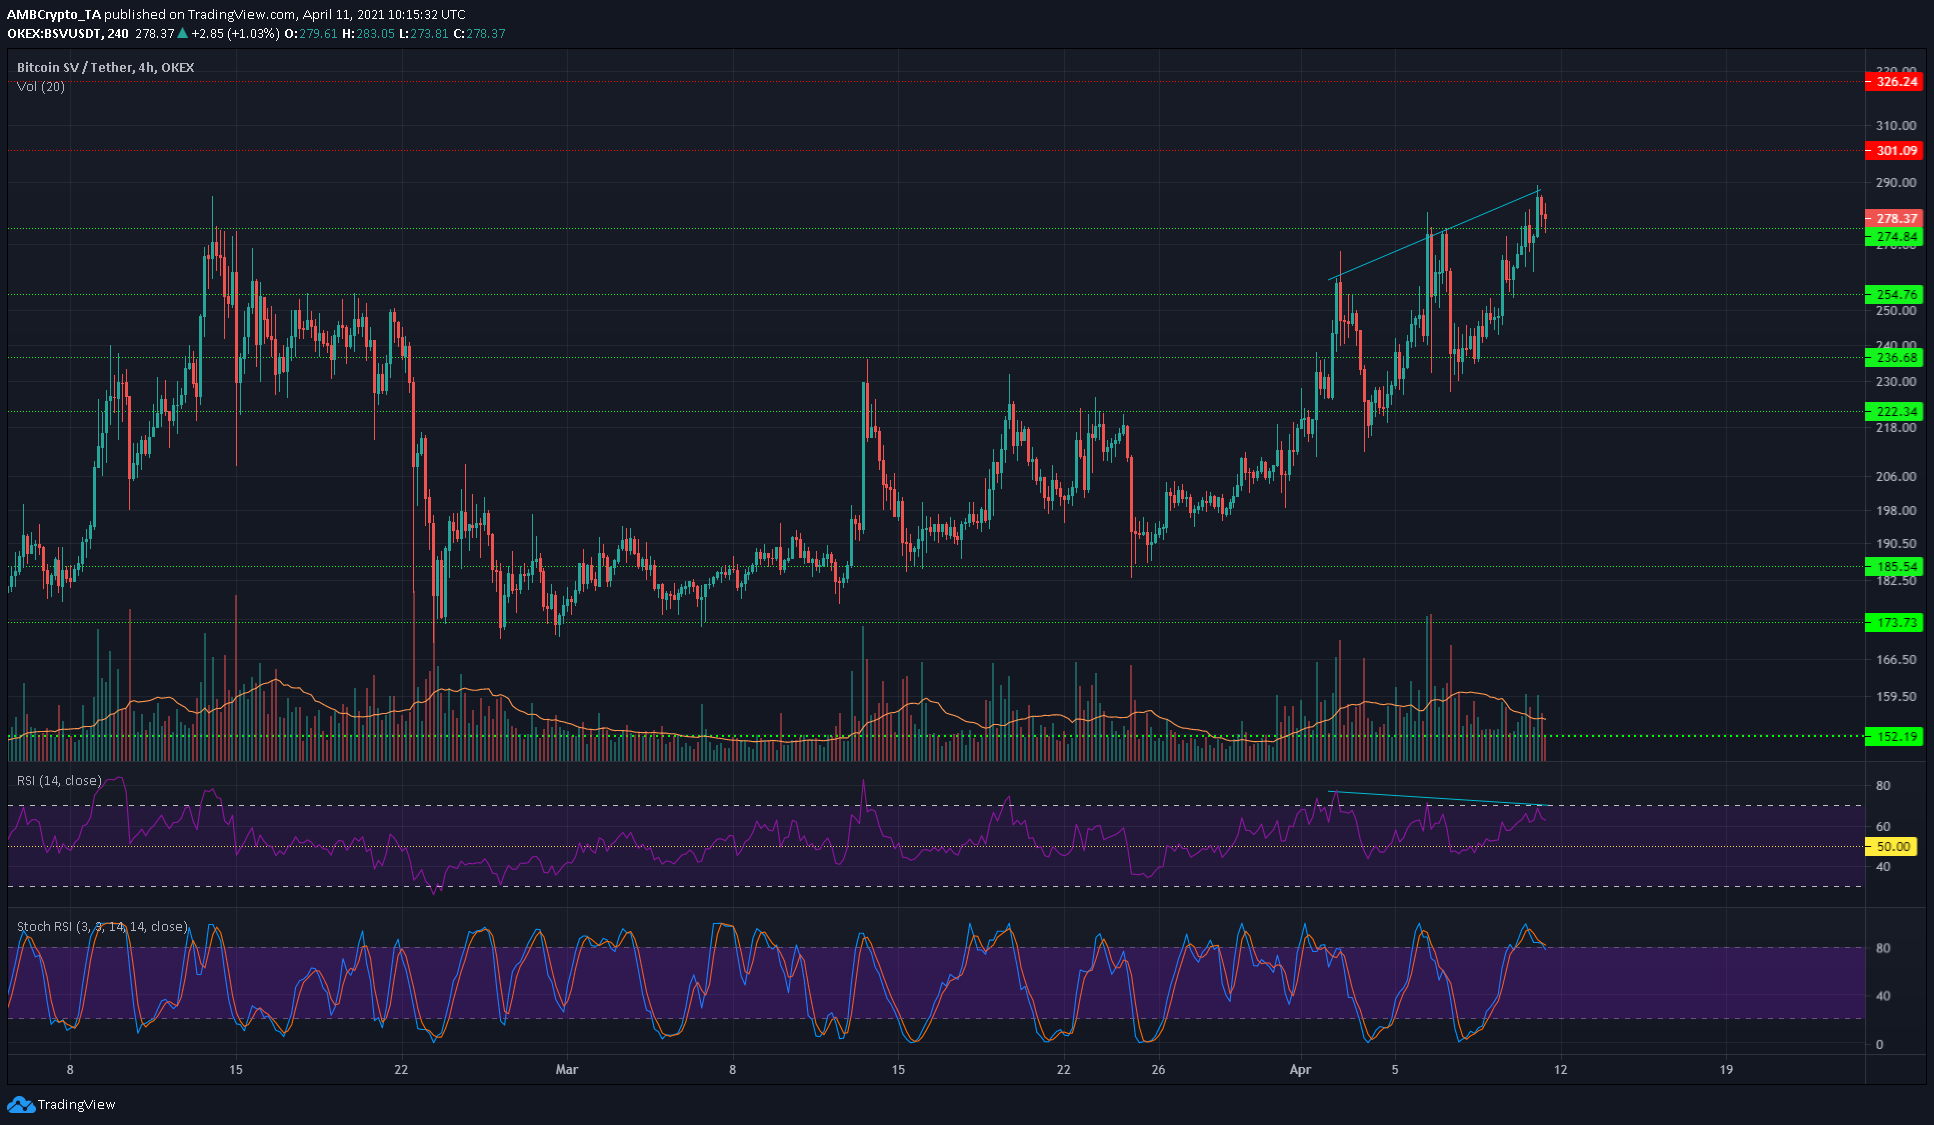
Source: BSV/USDT on TradingView
Bitcoin SV showed a bearish divergence between price and momentum. This was not an immediate sell signal, but it showed an overextended move and a pullback to the $260 area can be seen. The Stochastic RSI was also in the overbought area.
While individually neither indicator can be taken to show a sell signal, taken together and with the fact that trading volume is trending lower even as price reaches higher, the conclusion can only be that BSV is due for a pullback.
Compound [COMP]
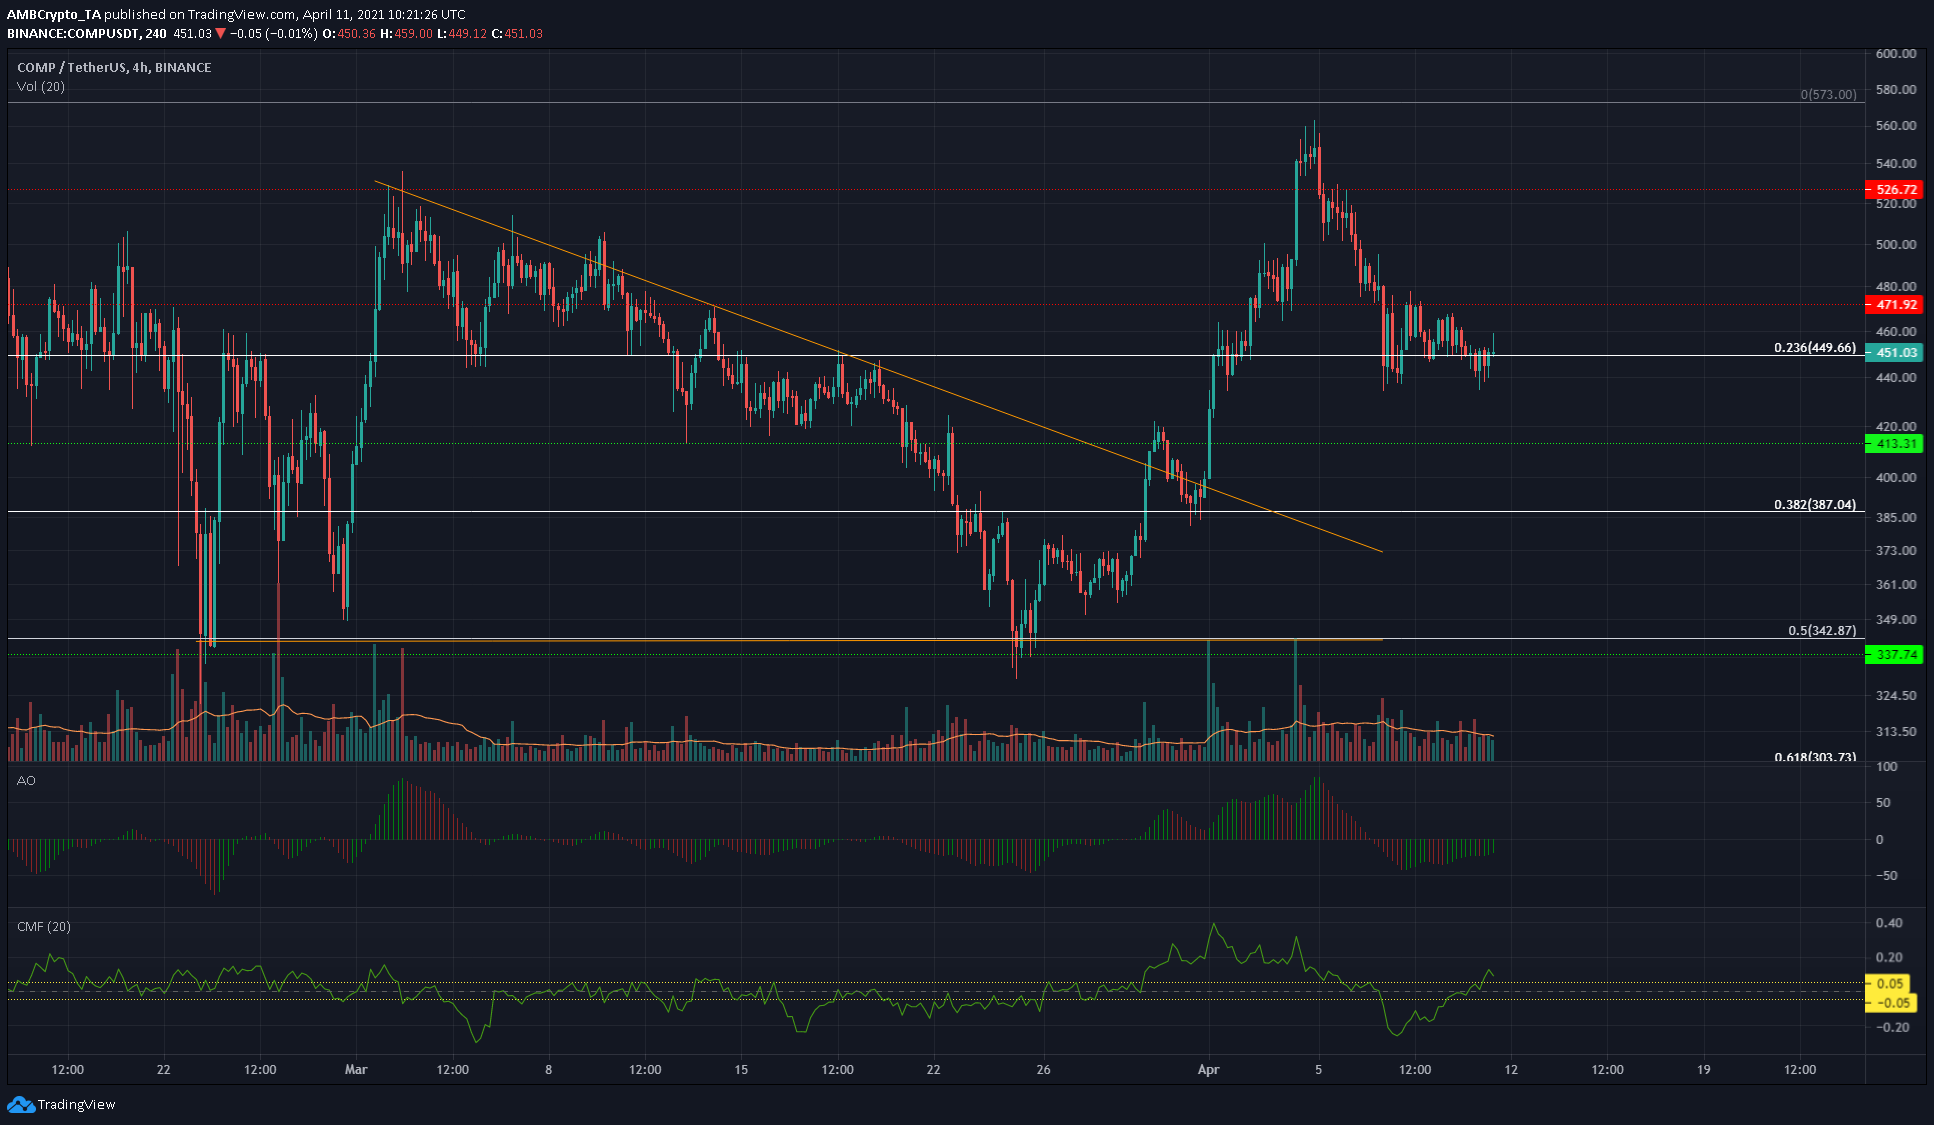
Source: COMP/USDT on TradingView
COMP formed a descending triangle pattern in the past month and broke out strongly to climb to the peak of the pattern at $520. COMP was able to touch $550 before selling pressure forced it to trade at $451 at the time of writing.
In the past few days, COMP has formed equal lows at $443 even as the Awesome Oscillator began to move back toward the zero line. This showed that bearish momentum was slowing down. The Chaikin Money Flow also climbed back above the +0.05 mark to indicate capital flow into the market was on the rise, a sign of demand for COMP.