
Cardano moved within an ascending channel and a breakdown was projected once it approached $1.49-resistance. Cosmos could dip towards $24.4 or $23 before the next upswing, while Hedera Hashgraph was likely to peak at $0.40-resistance before a pullback.
Cardano [ADA]

Source: ADA/USD, TradingView
A breakout above $1.33 resistance boosted Cardano to a new ATH at over $1.5, but the price retraced towards two support levels over the last few days. The first level of support at $1.38 came into focus after a pullback from record levels, while another support at $1.33 saw buying post a breakdown from an ascending channel (not shown). On the hourly timeframe, ADA traded in yet another ascending channel and a southbound break was expected at the peak of the pattern.
However, current market conditions tilted slightly in favor of the bulls and the price could continue to oscillate between the two trendlines before the sellers take advantage. This could likely happen at the upper ceiling of $1.49. According to the Awesome Oscillator, momentum was bullish-neutral, while the RSI pointed lower from 50.
Cosmos [ATOM]

Source: ATOM/USD, TradingView
While Cosmos was largely rangebound during the month of March, a breakout above $24.4-resistance fueled a bullish rally which peaked at $28.5. A minor correction was countered at $25.3-support and the bulls might need to defend this line again over the coming sessions.
The OBV made lower highs as selling pressure outmatched buying pressure. The ADX peaked at 30 but dropped below 22 at the time of writing and showed a weakening bullish trend. Further dips at $24.4 or $23 could open up buying opportunities before ATOM makes the next upswing.
Hedera Hashgraph [HBAR]
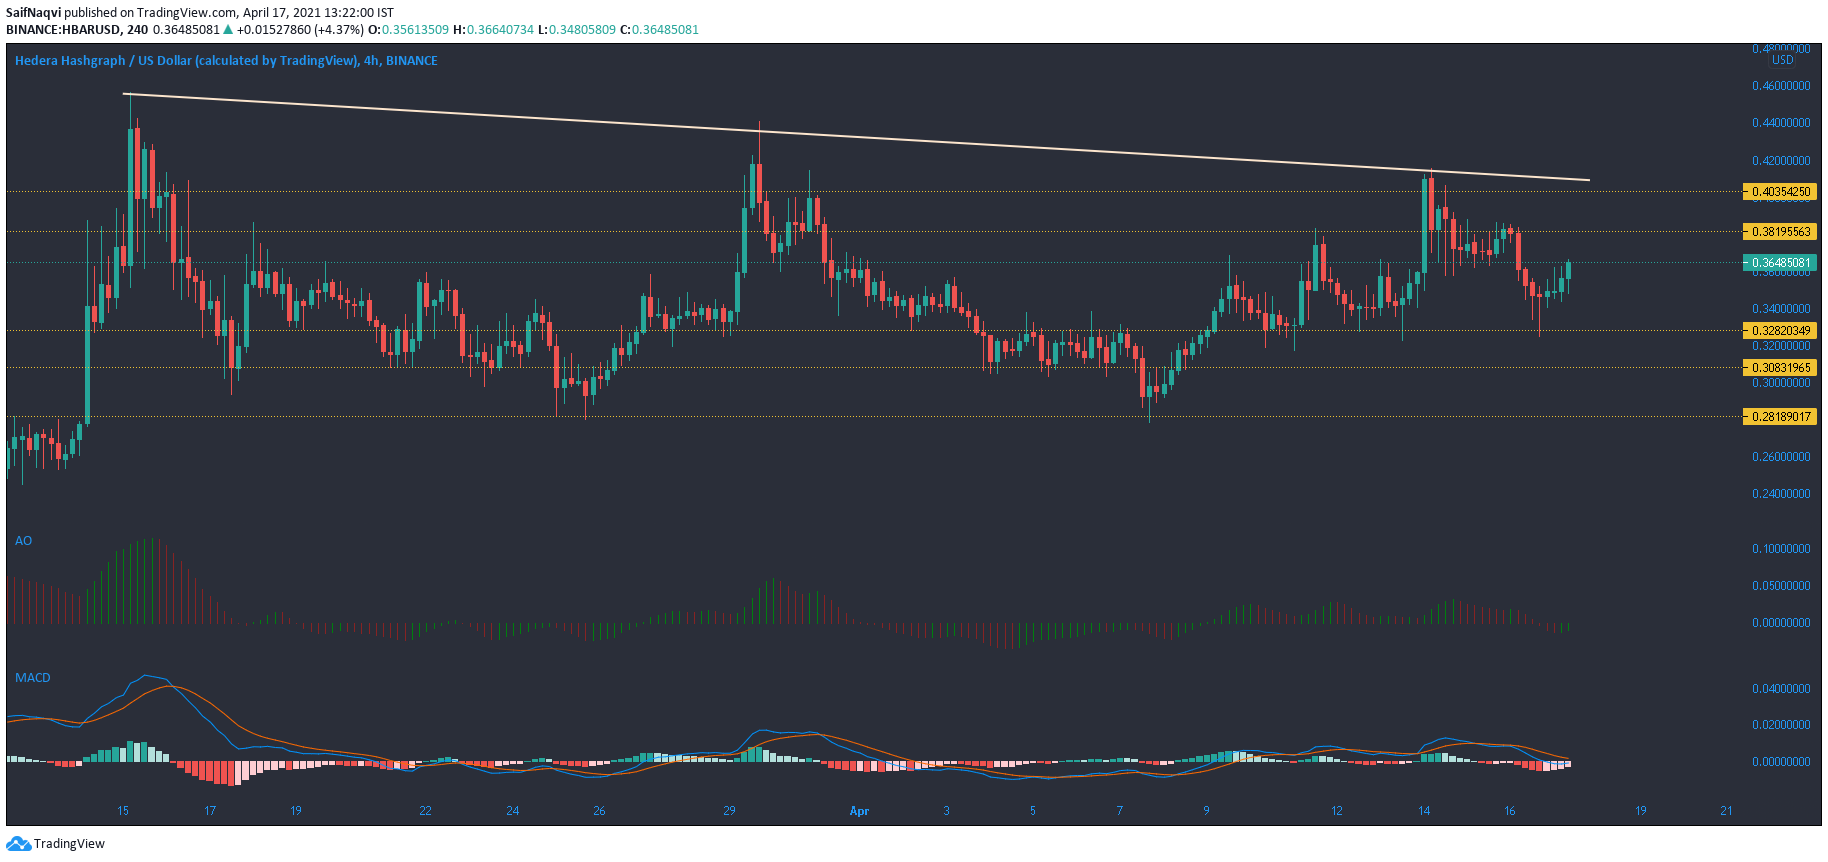
Source: HBAR/USD, TradingView
Hedera Hashgraph made three peaks on the 4-hour timeframe, each followed by downtrend and a bullish bounce back from various support levels. After the most recent fall towards $0.328 support, HBAR looked ready to make the next leg upwards.
The Awesome Oscillator was below the half-mark, but registered two consecutive green bars as momentum looked to shift sides. A move above 0 could open up some buying signals. The MACD line closed in on the Signal line, and a successful crossover would back a favorable outcome. A break above $0.38 was likely in a bullish scenario, but sellers were expected to step in at $0.40-resistance.