Cardano is still looking weak, but here’s how this might change

Disclaimer: The findings of the following article are the sole opinions of the writer and should not be considered investment advice
While the Cardano v. Ethereum debate is far from settled, ETH has a clear lead at the moment. Not only is ETH’s market cap over 8 times ADA’s, but over the past month, ADA’s ROI sits at an unpleasant 10% while the world’s largest altcoin boasts 32% returns.
On one end, ETH has been surpassing new milestones while on the other, ADA has remained restricted below a strong resistance zone. Although another symmetrical triangle was starting to take shape on ADA’s chart, it was not clear which side possessed the strength for a breakout.
Hence, key levels should be observed over the coming days for more clarity on ADA’s market proceedings.
Cardano Daily Chart
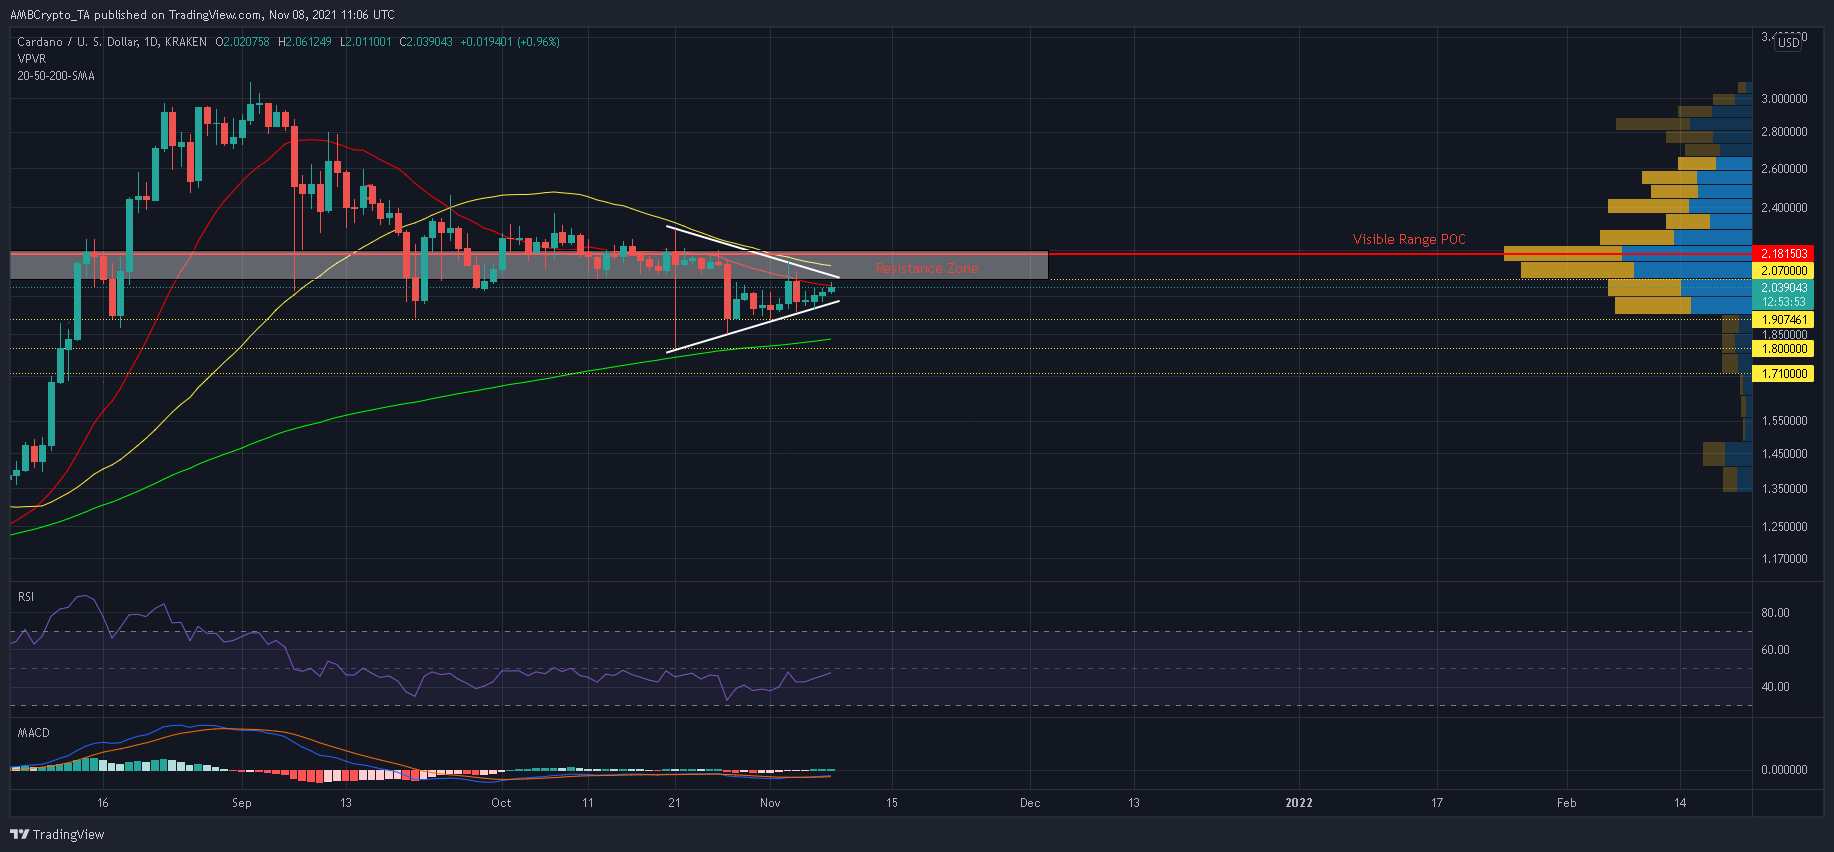
ADA has been at the behest of sellers for nearly 2 months now, with the alt trading at a 34% discount when compared to its September ATH of $3.09. During this drawdown, the 50-SMA (yellow) overtook the 20-SMA (red) – A reading which has been undesirable for bullish traders.
Moreover, its RSI and MACD have also remained below their respective half-lines and have shown no signs of complete recovery just yet. However, it’s worth noting that the RSI has been within an uptrend since 28 October and was about to challenge bearish pressure at 50. Should the RSI recover above 55, there could be a potential shift in market direction.
From there, ADA would need to close above the confluence of $2.07 resistance, 50-SMA (yellow), and Visible Range’s POC at $2.13. Should ADA surpass this major obstacle on strong volumes, the lack of strong resistance levels could see the alt recapture ground above $3.
However, a move in the opposite direction cannot be discounted, especially considering the RSI and MACD’s weak positions. Should ADA weaken below $1.95, a symmetrical triangle breakdown would drag the price all the way towards the 200-SMA (green), before any bullish countermeasures are taken.
Deeper retracements can be quelled at $1.80 and $1.71. Meanwhile, a risk-on broader market should prevent ADA from excessive bleeding beyond the aforementioned levels.
Conclusion
ADA’s symmetrical triangle carried more than a bearish threat, considering the nature of its RSI and MACD. To enforce a favorable outcome, ADA would need to gather numbers before tackling a solid overhead price ceiling. Once ADA successfully flips the $2.18-price ceiling, its bearish narrative could finally change for the better.


