Cardano shows early signs of halting the downtrend it has been on, since September

Cardano formed a series of equal lows at the $1.2 support level. Despite multiple tests of this support, the buyers had not crumbled, and in recent days they were actually able to push prices above a lower timeframe, descending triangle pattern.
The price of Cardano has contracted near the $1.2 lows for three weeks now, and it remains to be seen if it has gathered enough steam to rise again. A bullish Bitcoin could reinforce the buying pressure.
ADA: 12-hour chart
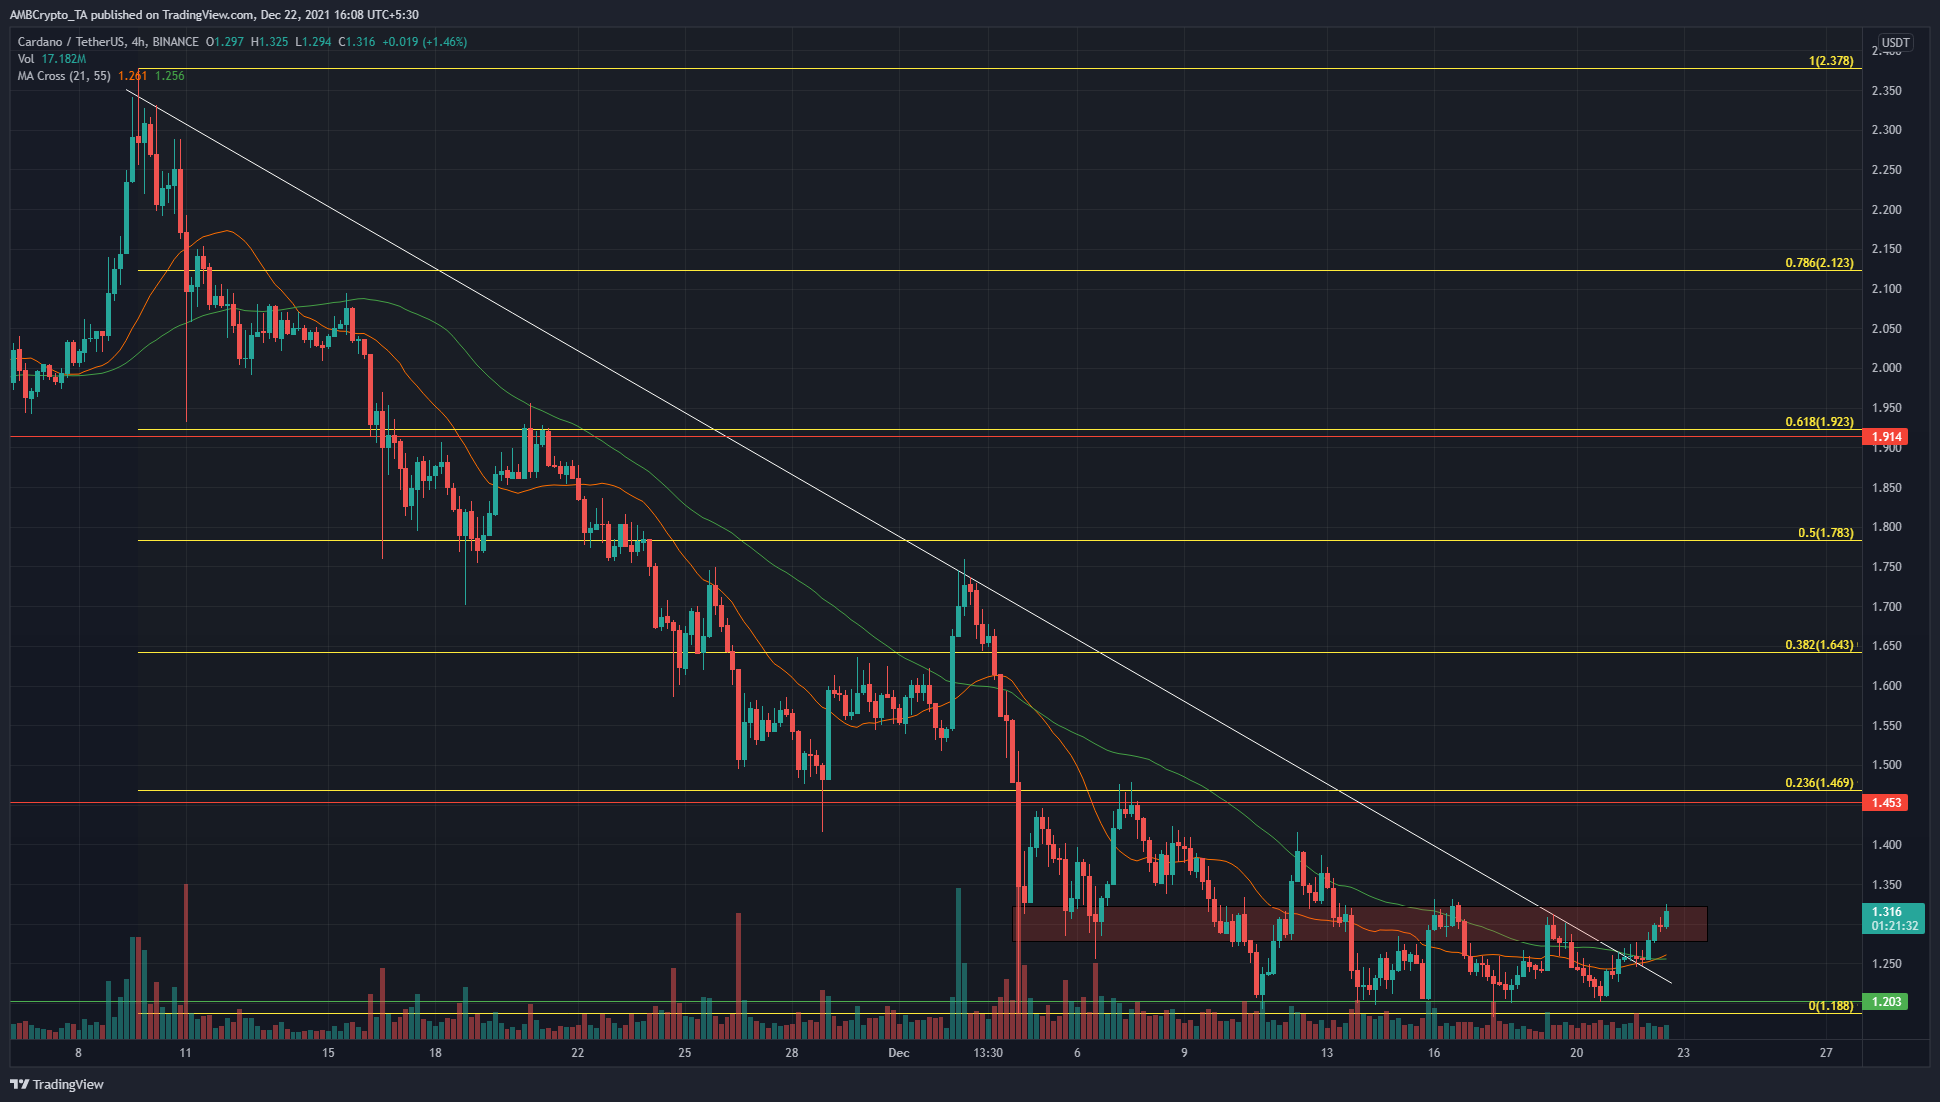
On the 4-hour chart, ADA was moving above the descending trendline that has acted as resistance since November. On shorter timeframes as well, ADA has formed a descending triangle pattern with December’s lower highs and support at the $1.2 level.
The $1.28-$1.32 area (red box) has offered some resistance in recent days, but ADA was trading within this area at the time of writing.
The Fibonacci retracement tool showed that the 23.6% retracement for ADA’s move from $2.37 to $1.2 was at $1.469. This was in confluence with the horizontal HTF resistance at $1.45, making this a key level for bulls to reclaim.
Even though selling pressure has been strong over the past few months, it was possible that the market was beginning to sway in the opposite direction.
Rationale
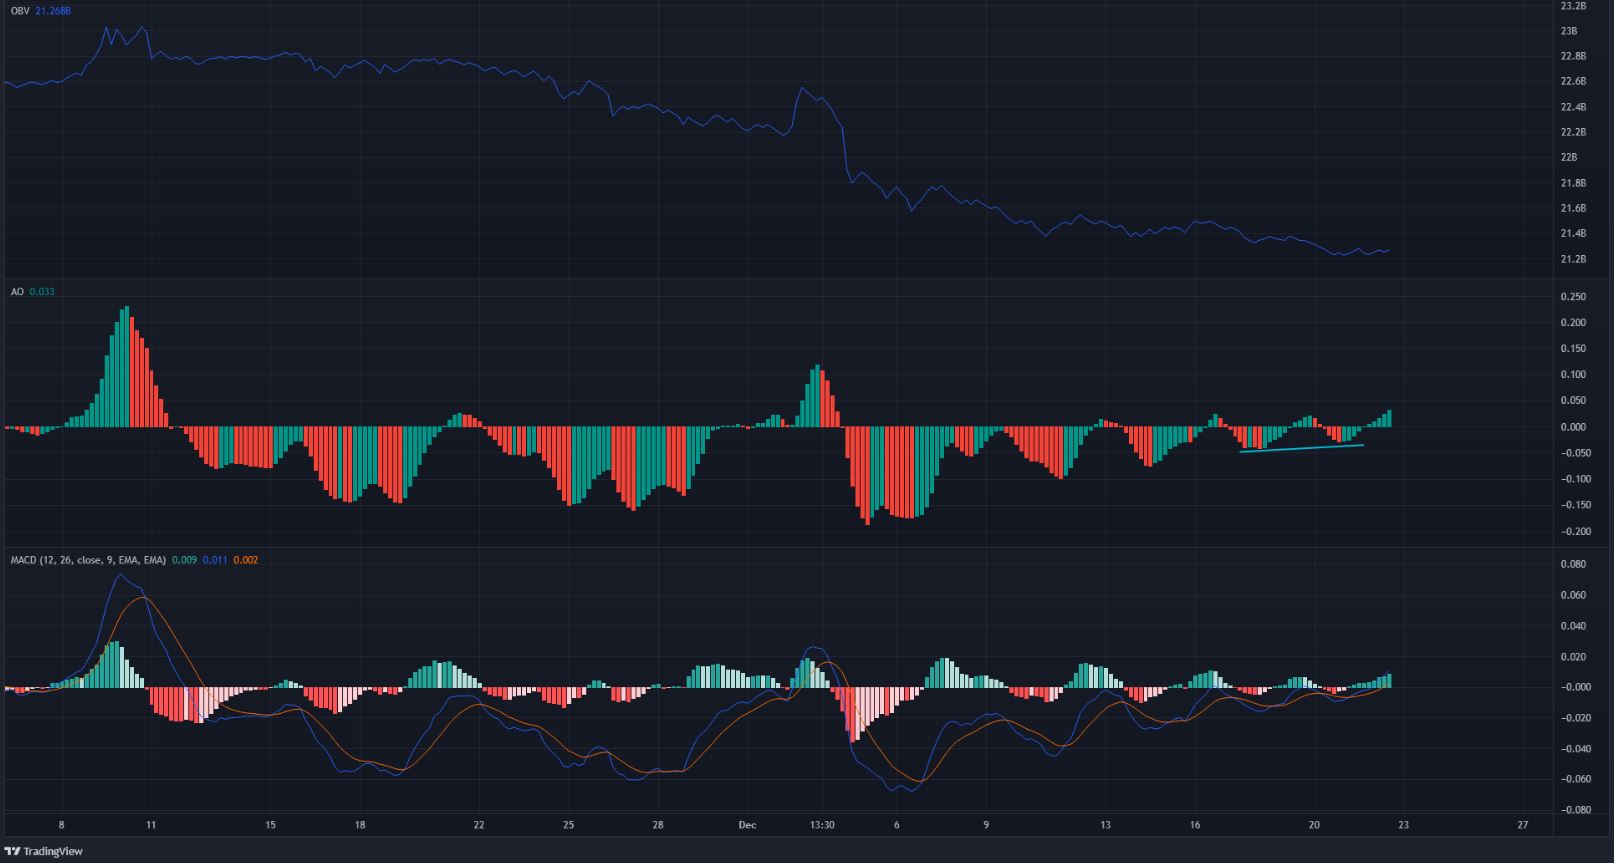
On the price chart, we see the 21 SMA (orange) on the verge of crossing over above the 55 SMA (green), showing a possible change in momentum. The MACD had also formed a bullish crossover and was about to climb past the zero line, again showing bullish momentum.
The Awesome Oscillator made a higher low even as the price made equal lows, an exaggerated bullish divergence.
In contrast to the change in momentum, buying volume has not yet appeared. Significant buying volume has to back up the change in momentum, and the OBV showed that buyers were not in control of the market.
Conclusion
The contrast between momentum and volume on the side of the indicators suggested that ADA might not yet have the confidence of investors. Reclaiming the 23.6% level alongside significant buying volume would be much stronger evidence of a market that has turned bullish, rather than what we have at hand.
The price action for ADA showed a possible lower timeframe breakout that could reach $1.45-$1.47, a key level for bulls to flip.


