Cardano, XRP, Solana Price Analysis: 16 January

After touching their multi-month lows on 10 January, Cardano, XRP and Solana saw noteworthy gains. However, the Bitcoin sentiment still strived to flip the ‘extreme fear’ zone.
Cardano jumped above its long-term Point of Control, but its OBV failed to correspond. XRP and Solana flipped their EMA resistance to support over the past six days but still needed to ramp up their volumes.
Cardano (ADA)
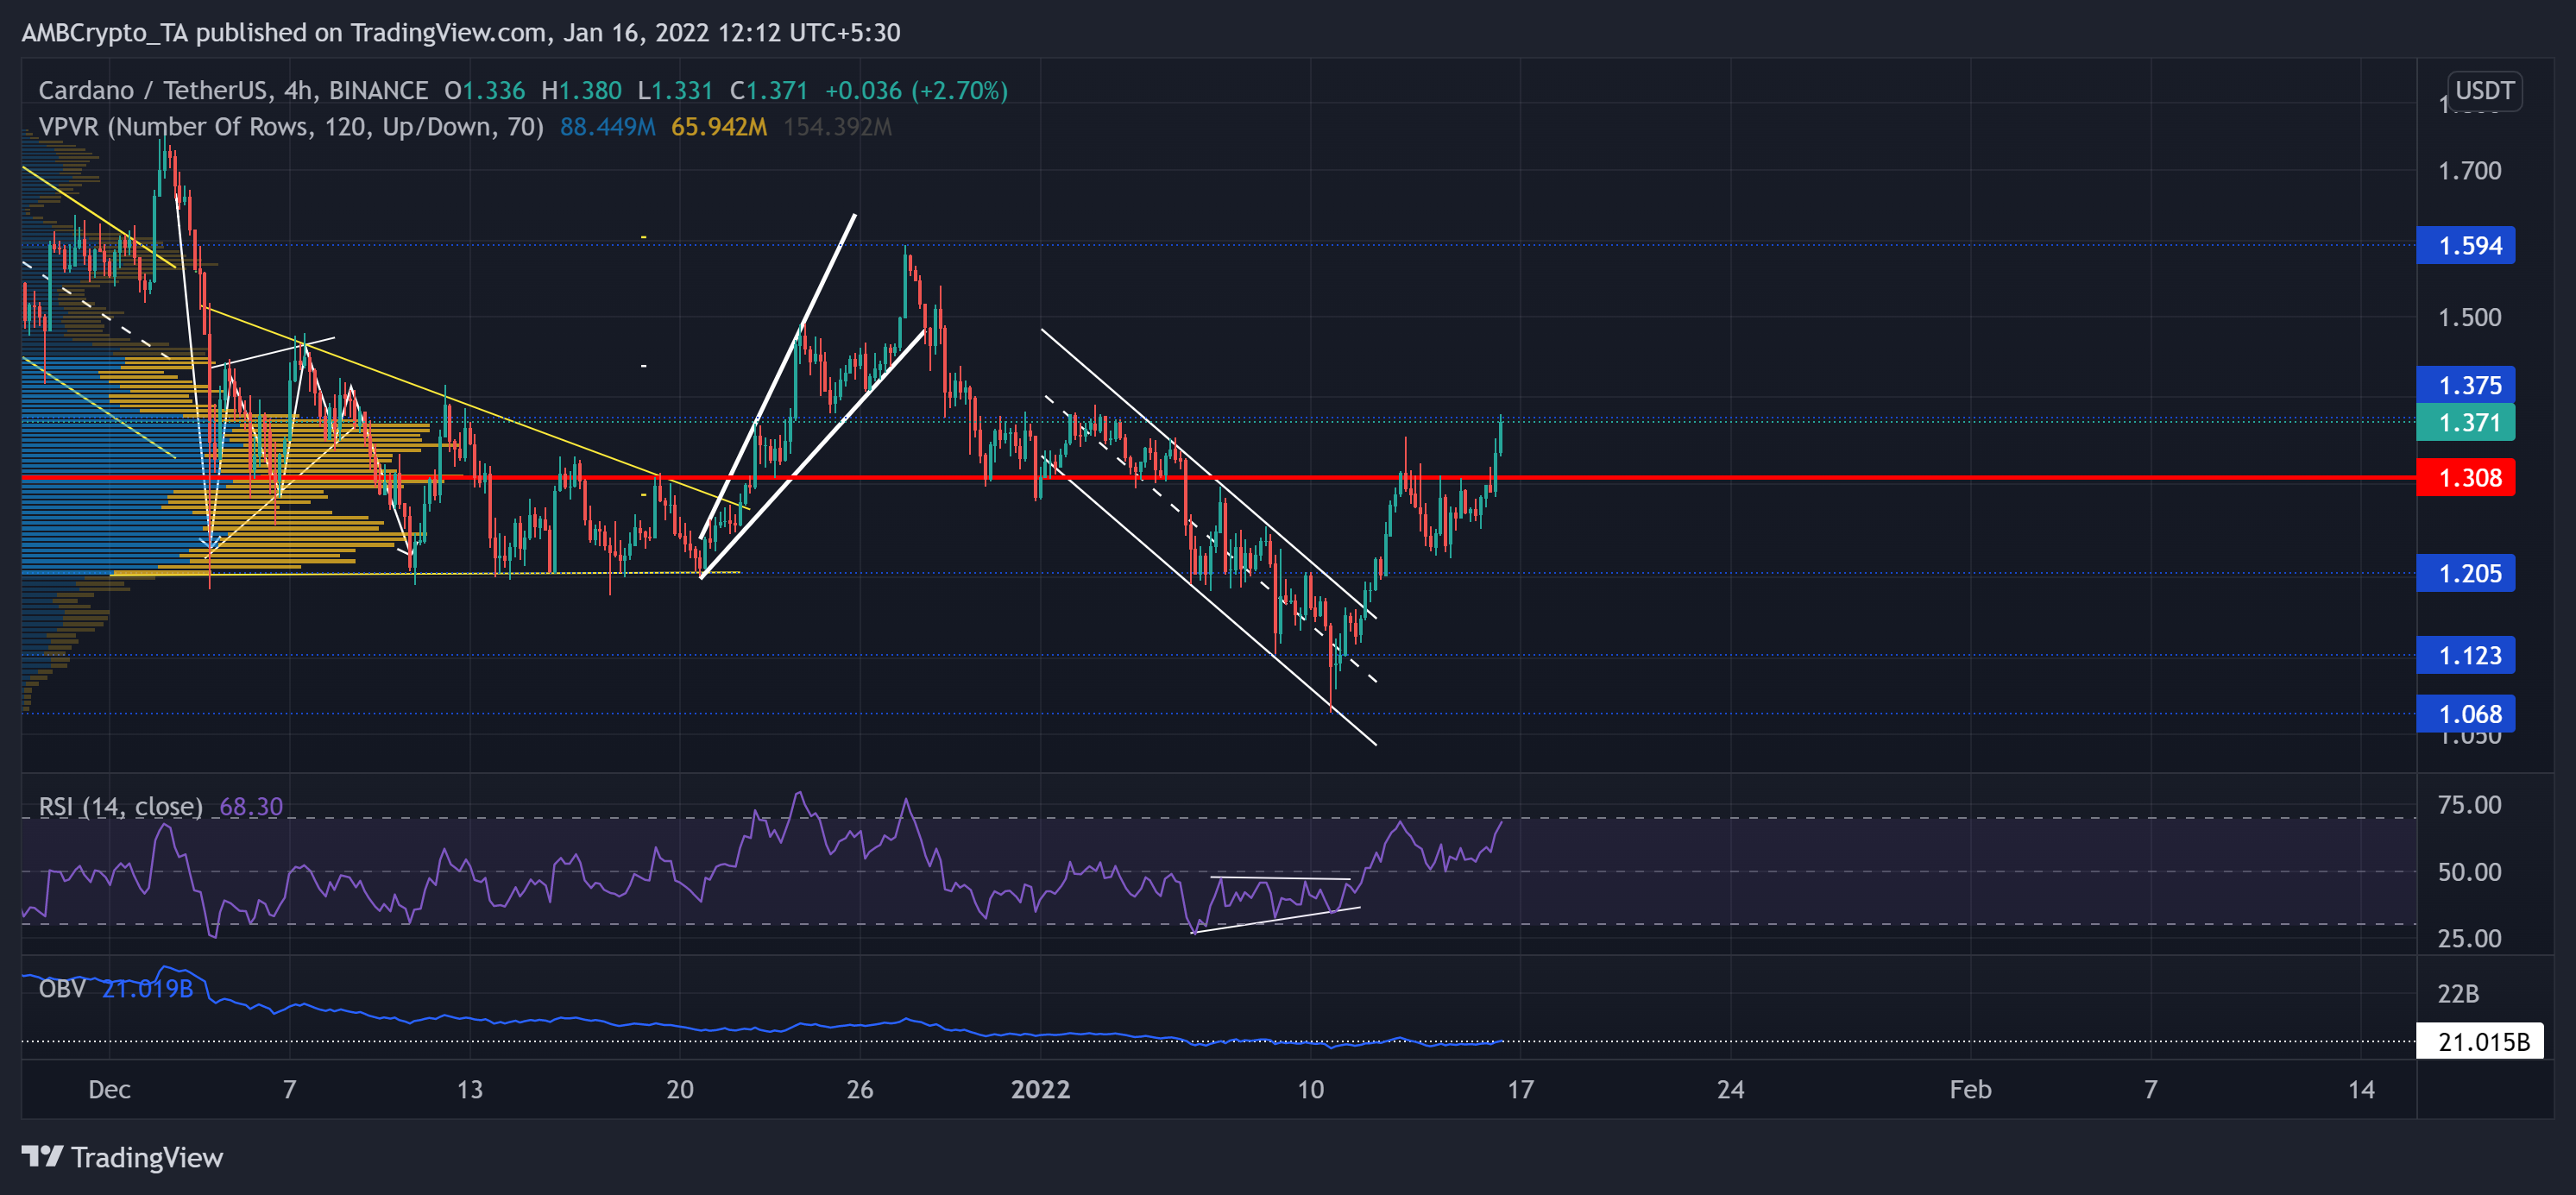
After dropping from the $1.5-mark on 27 December, ADA steeply downturned by 32.84% to poke its six-month low on 10 January. Then, as the alt hit the crucial $1.2-mark, it marked an impressive recovery over the past six days.
On its way up, ADA saw resistance at the Point of Contol (red) that offered the highest liquidity for over three months near the $1.3-mark. While the altcoin noted a 27.54% six-day ROI, it now endeavored to snap the $1.375-resistance. In terms of the alts’ buying strength, the OBV did not mark a corresponding spike. The reading, therefore, indicated a weak bull move.
At press time, ADA traded at $1.371. The RSI upturned after forming an ascending triangle on its 4-hour chart and ensured midline support. At the time of writing, it approached to test the overbought region before a likely dip.
XRP
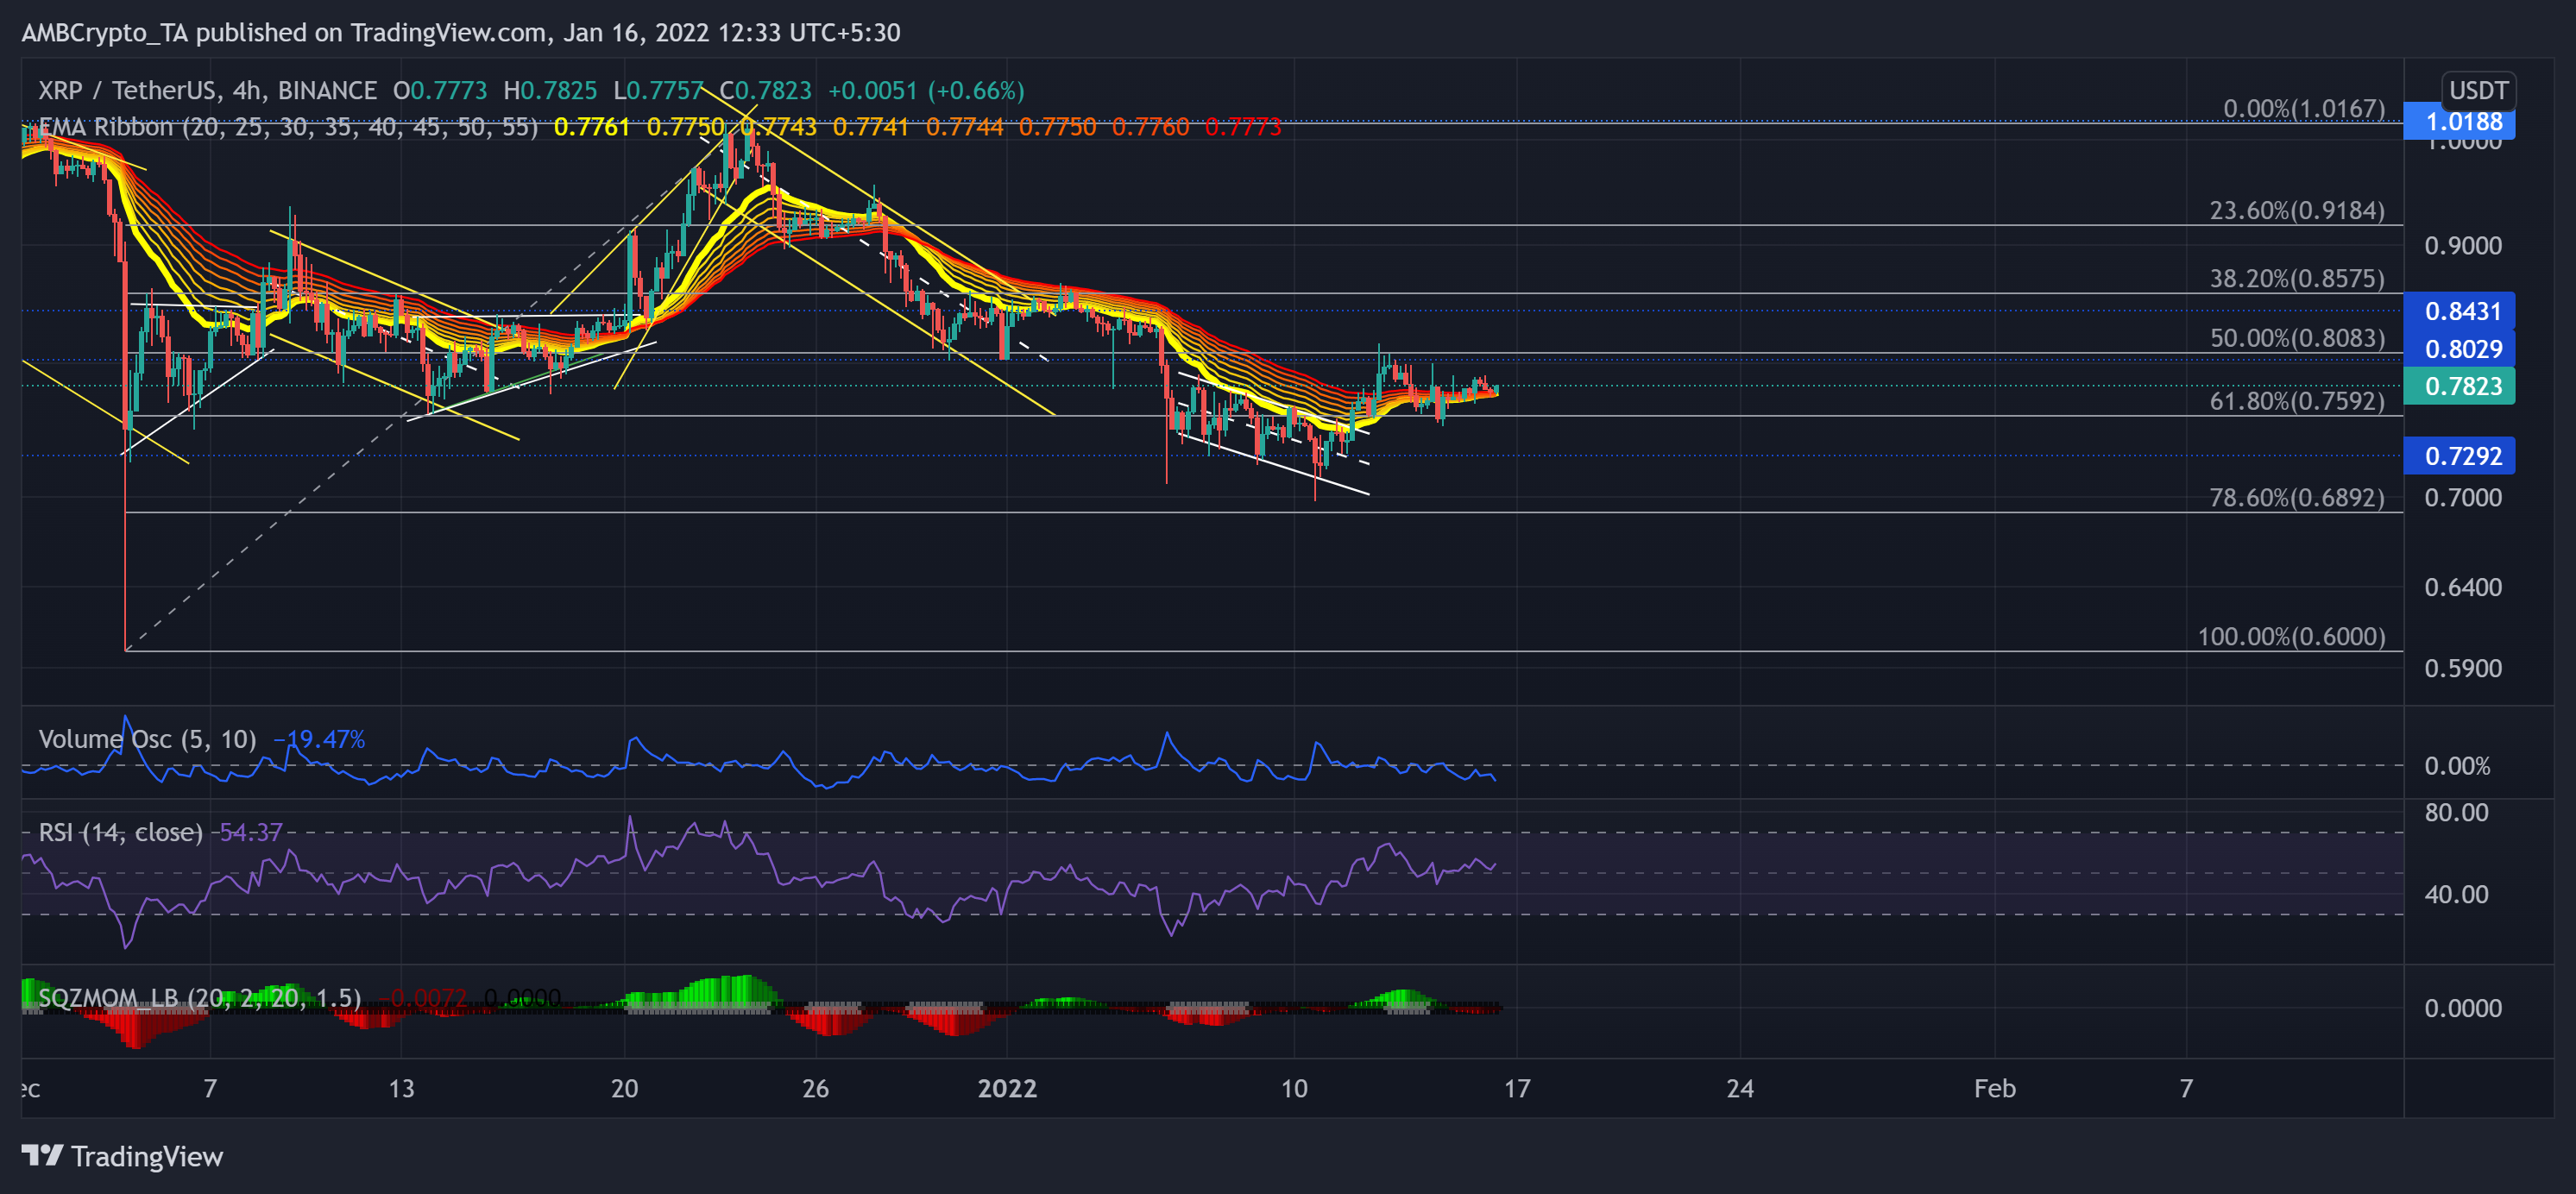
XRP downturned from the $1.01-mark resistance and formed two down-channels on its 4-hour chart over the past 23 days. The alt lost over 30% of its value (since 27 December high) and tested the $0.7292-mark five-month support.
Over the past six days, the alt reclaimed the 61.8% Fibonacci support and skewed the EMA ribbons towards the bullish side. After breaching the 20-EMA resistance, the alt struggled to cross the $0.8029-mark. During the recent bull run, the Volume Oscillator marked lower peaks, indicating a flimsy bull move.
At press time, XRP traded at $0.7823. The RSI managed to find midline support after a slight bullish preference. Nevertheless, the Squeeze Momentum Indicator flashed a low volatility phase.
Solana (SOL)

The 5 January triggered a steep decline as the alt saw a descending triangle (white) breakout. While the buyers failed to step in, the alt saw an over 23% retracement (from 5 January) until it poked its 15-week low on 10 January.
It flashed recovery signs after testing the $132-support multiple times. The 14.4% rise over the past six days led SOL to find a close above all its EMA ribbons. As the gap between the ribbons lessened, the buying influence amplified.
Now, SOL formed a rising wedge (white) on its 4-hour chart. Any close above $149 could further lead to a test of $154-resistance.
At press time, the alt traded at $148.6525. The RSI was bullish after ensuring the midline support. Also, the DMI reaffirmed a bullish preference while the ADX (directional trend) was extremely weak.