Chainlink: Longing LINK investors can pause and buckle up for what’s to come

Chainlink [LINK] spiked above $9.20 for the first time in a while, registering a three-month high despite the volatile market situation. The coin was also able to put a smile on investors’ faces as it registered a promising weekly gain of over 12%.
At press time, Chainlink was trading at $8.72, with a market capitalization of over $4.2 billion, as per data from CoinMarketCap.
____________________________________________________________________________________________
Here’s AMBCrypto’s Price Prediction for Chainlink [LINK] for 2023-2024
_______________________________________________________________________
According to Santiment’s tweet, several on-chain metrics were also in favor of LINK, which implied towards a continued price hike over the coming days.
? #Chainlink spiked all the way above $9.20 for the first time since August 13th, a ~3 month high despite very volatile markets. This rise has been supported by the largest amount of active $LINK addresses in 5 weeks, and traders are longing aggressively. https://t.co/ZxsZnveURm pic.twitter.com/lia6XAgSar
— Santiment (@santimentfeed) November 8, 2022
Apart from Santiment’s aforementioned update, Chainlink also witnessed various developments last week that could be responsible for the ongoing pump. For instance, Chainlink went through with 14 integrations across four chains, namely Arbitrum, BNBChain, Ethereum, and Polygon.
⬡ Chainlink Adoption Update ⬡
This week, there were 14 integrations of 4 #Chainlink services across 4 different chains: #Arbitrum, #BNBChain, #Ethereum, and #Polygon.
Reminder: Check your Staking v0.1 eligibility now. https://t.co/Gdt5Fj7XGp pic.twitter.com/vUj2ykfzeq
— Chainlink (@chainlink) November 6, 2022
Metrics at play
According to Santiment’s chart, LINK received significant interest from the derivatives market as its exchange funding rate hit a record high since August. Further, the coin’s address activity took the same path and registered a massive uptick, which could be considered as another positive signal.
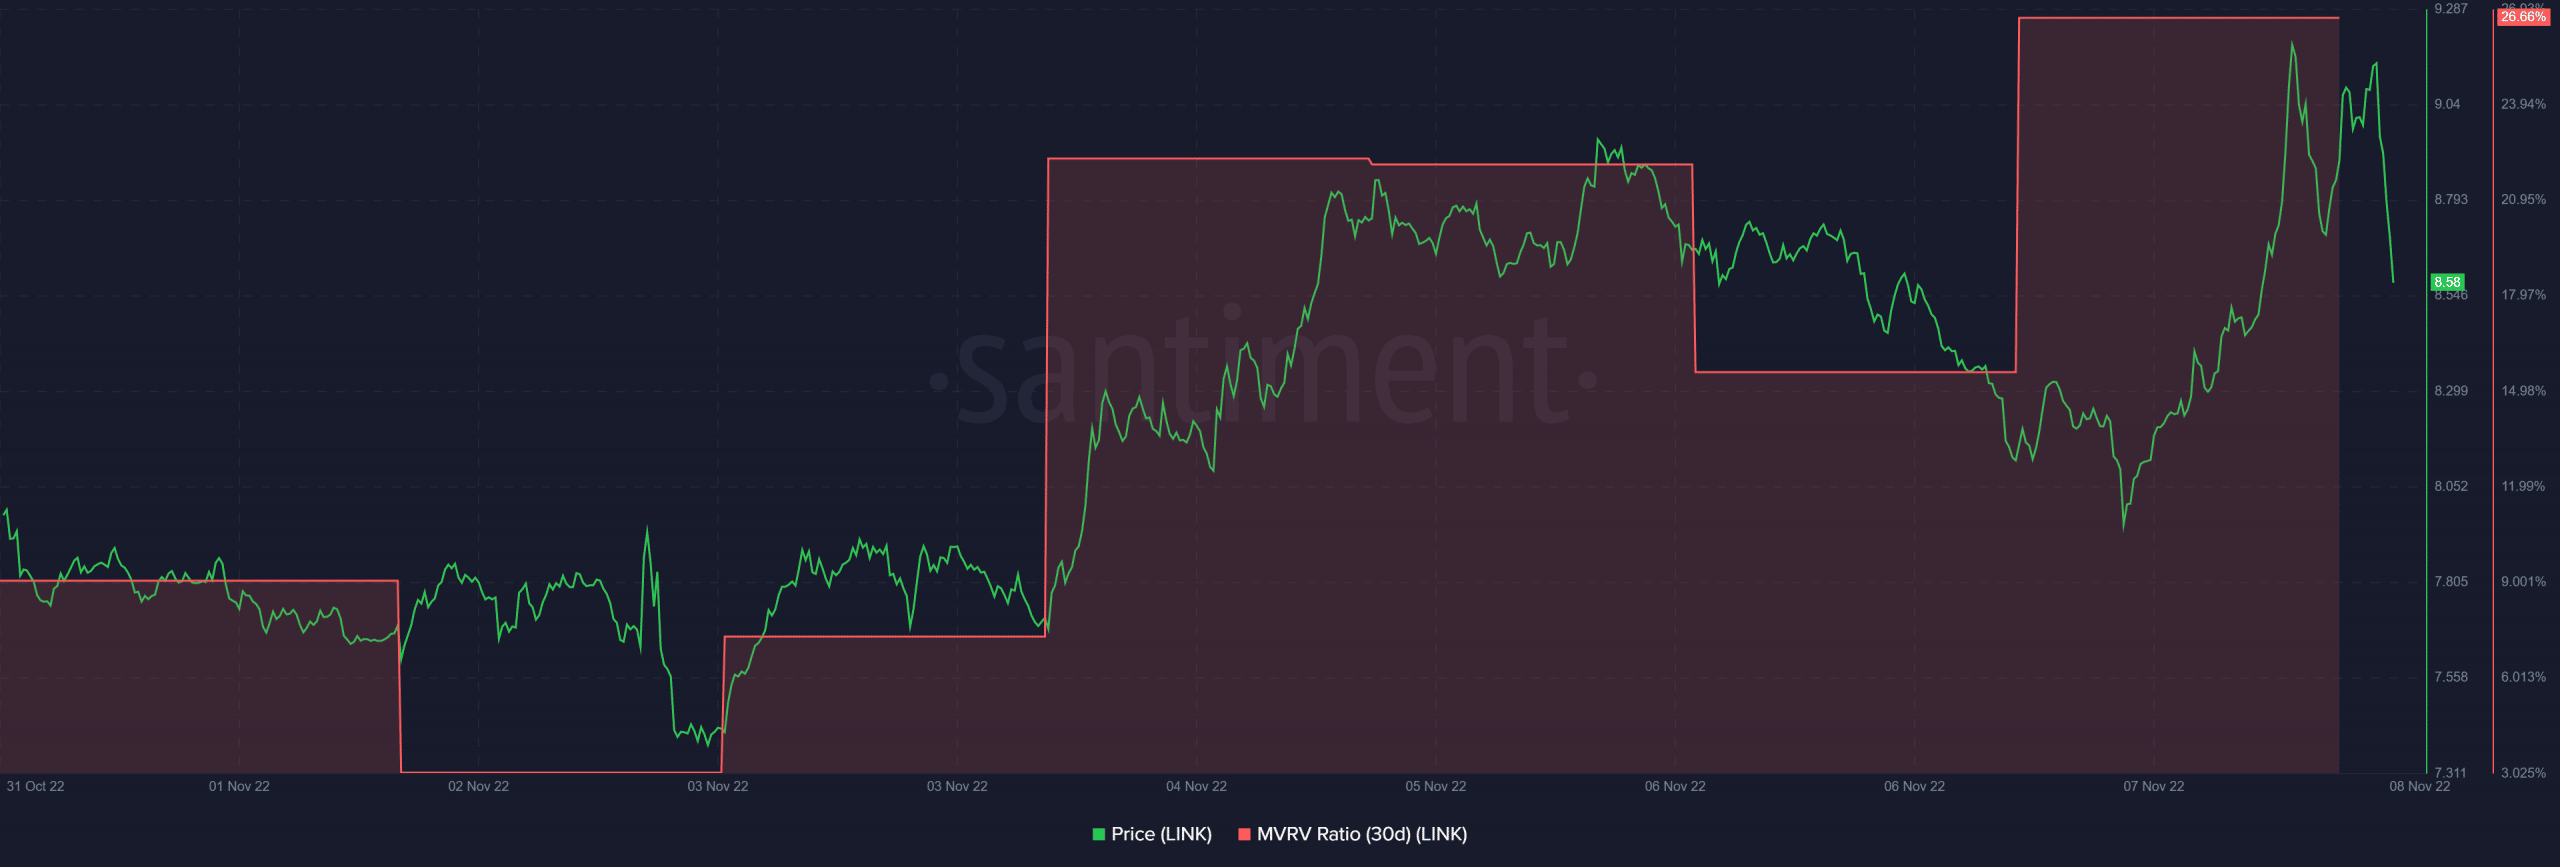
However, the other metrics could trouble concerned investors as they indicated an upcoming trend reversal. For instance, LINK’s Market Value to Realized Value (MVRV) Ratio was considerably up. This indicated a possible market peak.
CryptoQuant’s data also revealed that things were about to get worse, as LINK’s Relative Strength Index (RSI) was in an overbought position. This increased the chances of a selloff in the days to come. Moreover, LINK’s exchange reserves also witnessed a rise, which was a bearish signal that indicated higher selling pressure.
Should investors pack their bags?
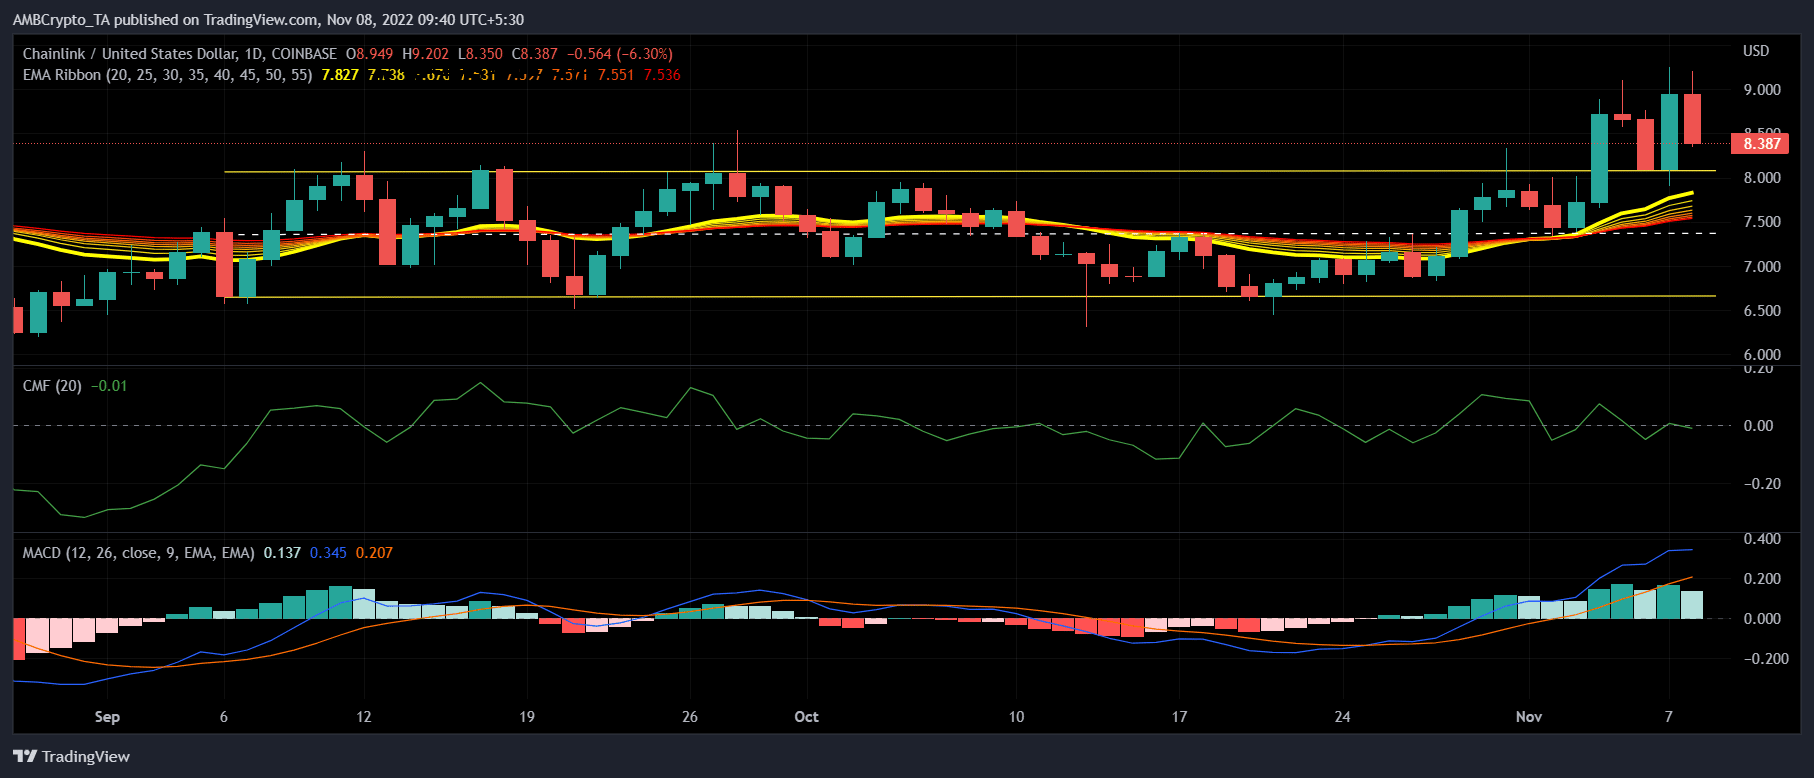
Maybe not, as LINK’s daily chart revealed an interesting picture. LINK, after sticking to a sideways route for a few weeks, broke out and turned its resistance into a new support level. The other metrics also looked quite bullish. For example, the Exponential Moving Average (EMA) Ribbon revealed that the bulls had a massive upper hand in the market. This was because the 20-day EMA was well above the 55-day EMA.
Moreover, the Moving Average Convergence Divergence (MACD)’s findings also supplemented those of the EMA Ribbon, as it too suggested a buyer’s advantage. However, the Chaikin Money Flow (CMF) was resting near the neutral position, which could have LINK go either way.


