Chainlink Price Analysis: 21 May

Disclaimer: The findings of the following article are the sole opinions of the writer and should not be taken as investment advice
Chainlink and its oracles have received quite a lot of attention in 2020 and 2021. This popularity has helped fuel positive sentiment in the LINK market, with the same pushing the asset’s price north by 164% since the beginning of the year.
When bearish market volatility hit the LINK market, its value collapsed by 47%. At the time of press, LINK was trading at $28.85 while its market capitalization was around $12.46 billion.
Chainlink daily chart
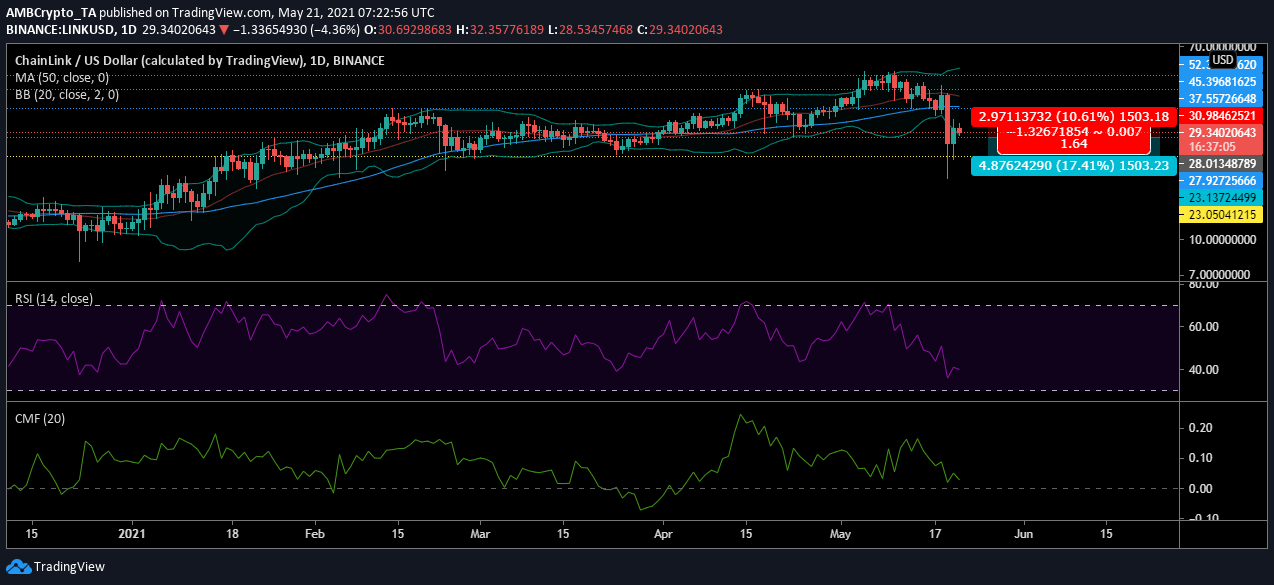
Chainlink’s daily chart pointed out that the price has been trending lower since early May. The downtrend only accelerated with the fall witnessed in the Bitcoin market after which the asset tried to recover. Even though the longest red wick on the chart showed that the low during the fall was at $18.56, LINK’s market bounced back quickly and its value was pushed back above the $28-mark.
As the project makes further strides in the crypto-space, LINK’s market still projects pronounced bearish overtones which could lead the asset to test the support level at $23.05 once again.
Reasoning
The market indicators suggested that volatility was on the rise and was not going to reduce anytime soon. This put LINK in a vulnerable spot as the asset’s price was already trying to heal from the most recent fall. The significant volatility could send the LINK token to the support level as bearishness prevails. As per the Signal line, the price was still trending lower, and a sudden sell-off could result in a fall of almost 17%.
On the contrary, the selling pressure has remained dominant in the market. This was stressed by the Relative Strength Index slipping from the overbought zone towards the oversold zone. As the price slipped, the selling pressure was bound to increase as many traders wanted to realize their profits before the dump. This contributed to the asset moving dangerously close to the oversold territory.
Finally, the money that had remained in the market for so long due to the rising price was now approaching the 0-level and may sink under it. According to the Chaikin Money Flow, ever since the peak, LINK’s market has been seeing more money enter its market. After the fall and subsequent cash-out, however, money was seen leaving the market at an accelerated pace.
Crucial levels to watch out for
Entry-level: $28.01
Take Profit: $23.13
Stop-level: $30.98
Risk to Reward: 1.64
Conclusion
While Chainlink’s press time market had made some recovery, the future still looked a bit grim. LINK’s market indicators suggested that the market face another hit in the long-term as the selling pressure remained high. This could lead to LINK stopping at the next support level at $23 and traders may want to practice caution.


