Ethereum: Watch out for this over the next 24 hours!

Ethereum noted its biggest weekly drawdown since March 2020 after its descent from $4,375 was met at a low of $1880. Several factors played a role during the meltdown, with BTC’s decline driving the mayhem. However, one of the key factors identified here, one which dragged the market further than expected was the long contracts liquidation squeeze.
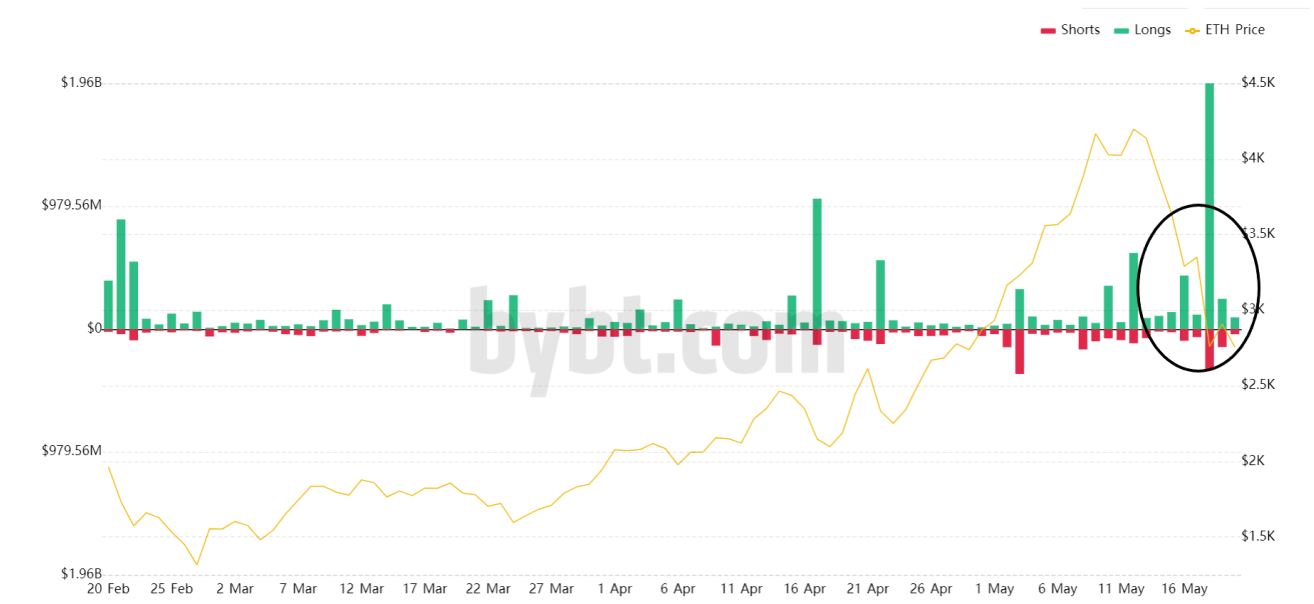
According to data, Ethereum long contracts across all exchanges recorded a collective liquidation of $1.96 billion. In fact, it can be observed that the drop below the $3,300-range coincided with the liquidations, a development that contributed to a long contract squeeze, hence taking the value down.
At press time, Ethereum’s value was still oscillating between $2,500-$3,000. However, a crucial move may take place in the next few hours.
Ethereum Contract expiry on 21 May – Another level change?
While the market is currently blowing off some volatility steam, things may take a significant turn for Ethereum yet again. The importance of liquidations and contract expiries has been highlighted previously and data from Skew seemed to suggest that 21 May is an important date.
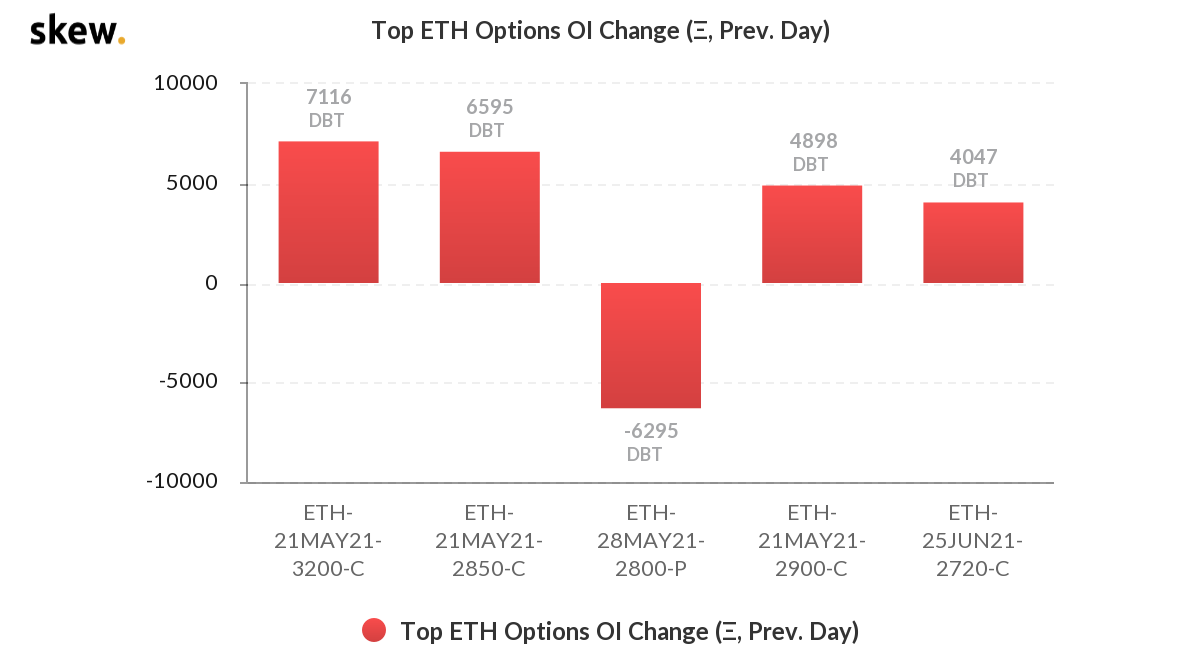
As indicated above, post-May 21st, a significant volume of ETH Options contracts are heading towards an expiry. Most of these are designated call buys and the overall expectancy is a daily close above $2,700.
At press time, Ethereum was just under the $2,700-range. The most important takeaway from this dataset is that the profitable expiry of these contracts may allow Ethereum to extend ahead with a bullish recovery. On the flip side, a daily close under $2,700 could be detrimental and trigger another lower retracement near the $2,500-$2,000 range.
Implied Volatility indicating a potential shift?
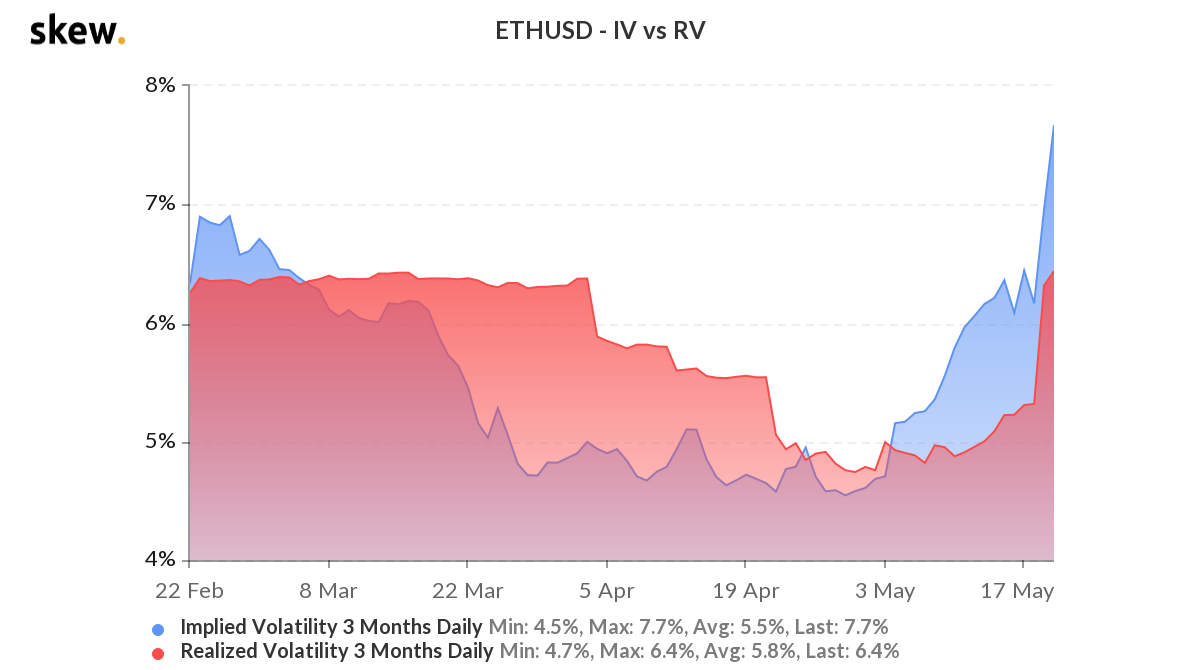
While the market appeared calm at the time of writing, ETH’s implied volatility was at its highest in over 3 months. The chart indicates that the Implied Vol had outperformed Realized Vol over the month of May. What this meant was that the market is expected to move more in terms of price, which can be in either direction.
IV above RV usually points to a trend where the price movement has not finished on a conclusive bottom or top.
Do the above facts confirm transition?
Not 100%. It is important to note that Options contracts represent only a fraction of the market. It may potentially trigger a change, but it is not certain. And yet, increased implied volatility suggests turbulence, something that cannot be ignored during a period of corrections.


