Chiliz [CHZ]: How buyers can leverage this breakout to remain profitable

Disclaimer: The findings of the following analysis are the sole opinions of the writer and should not be considered investment advice.
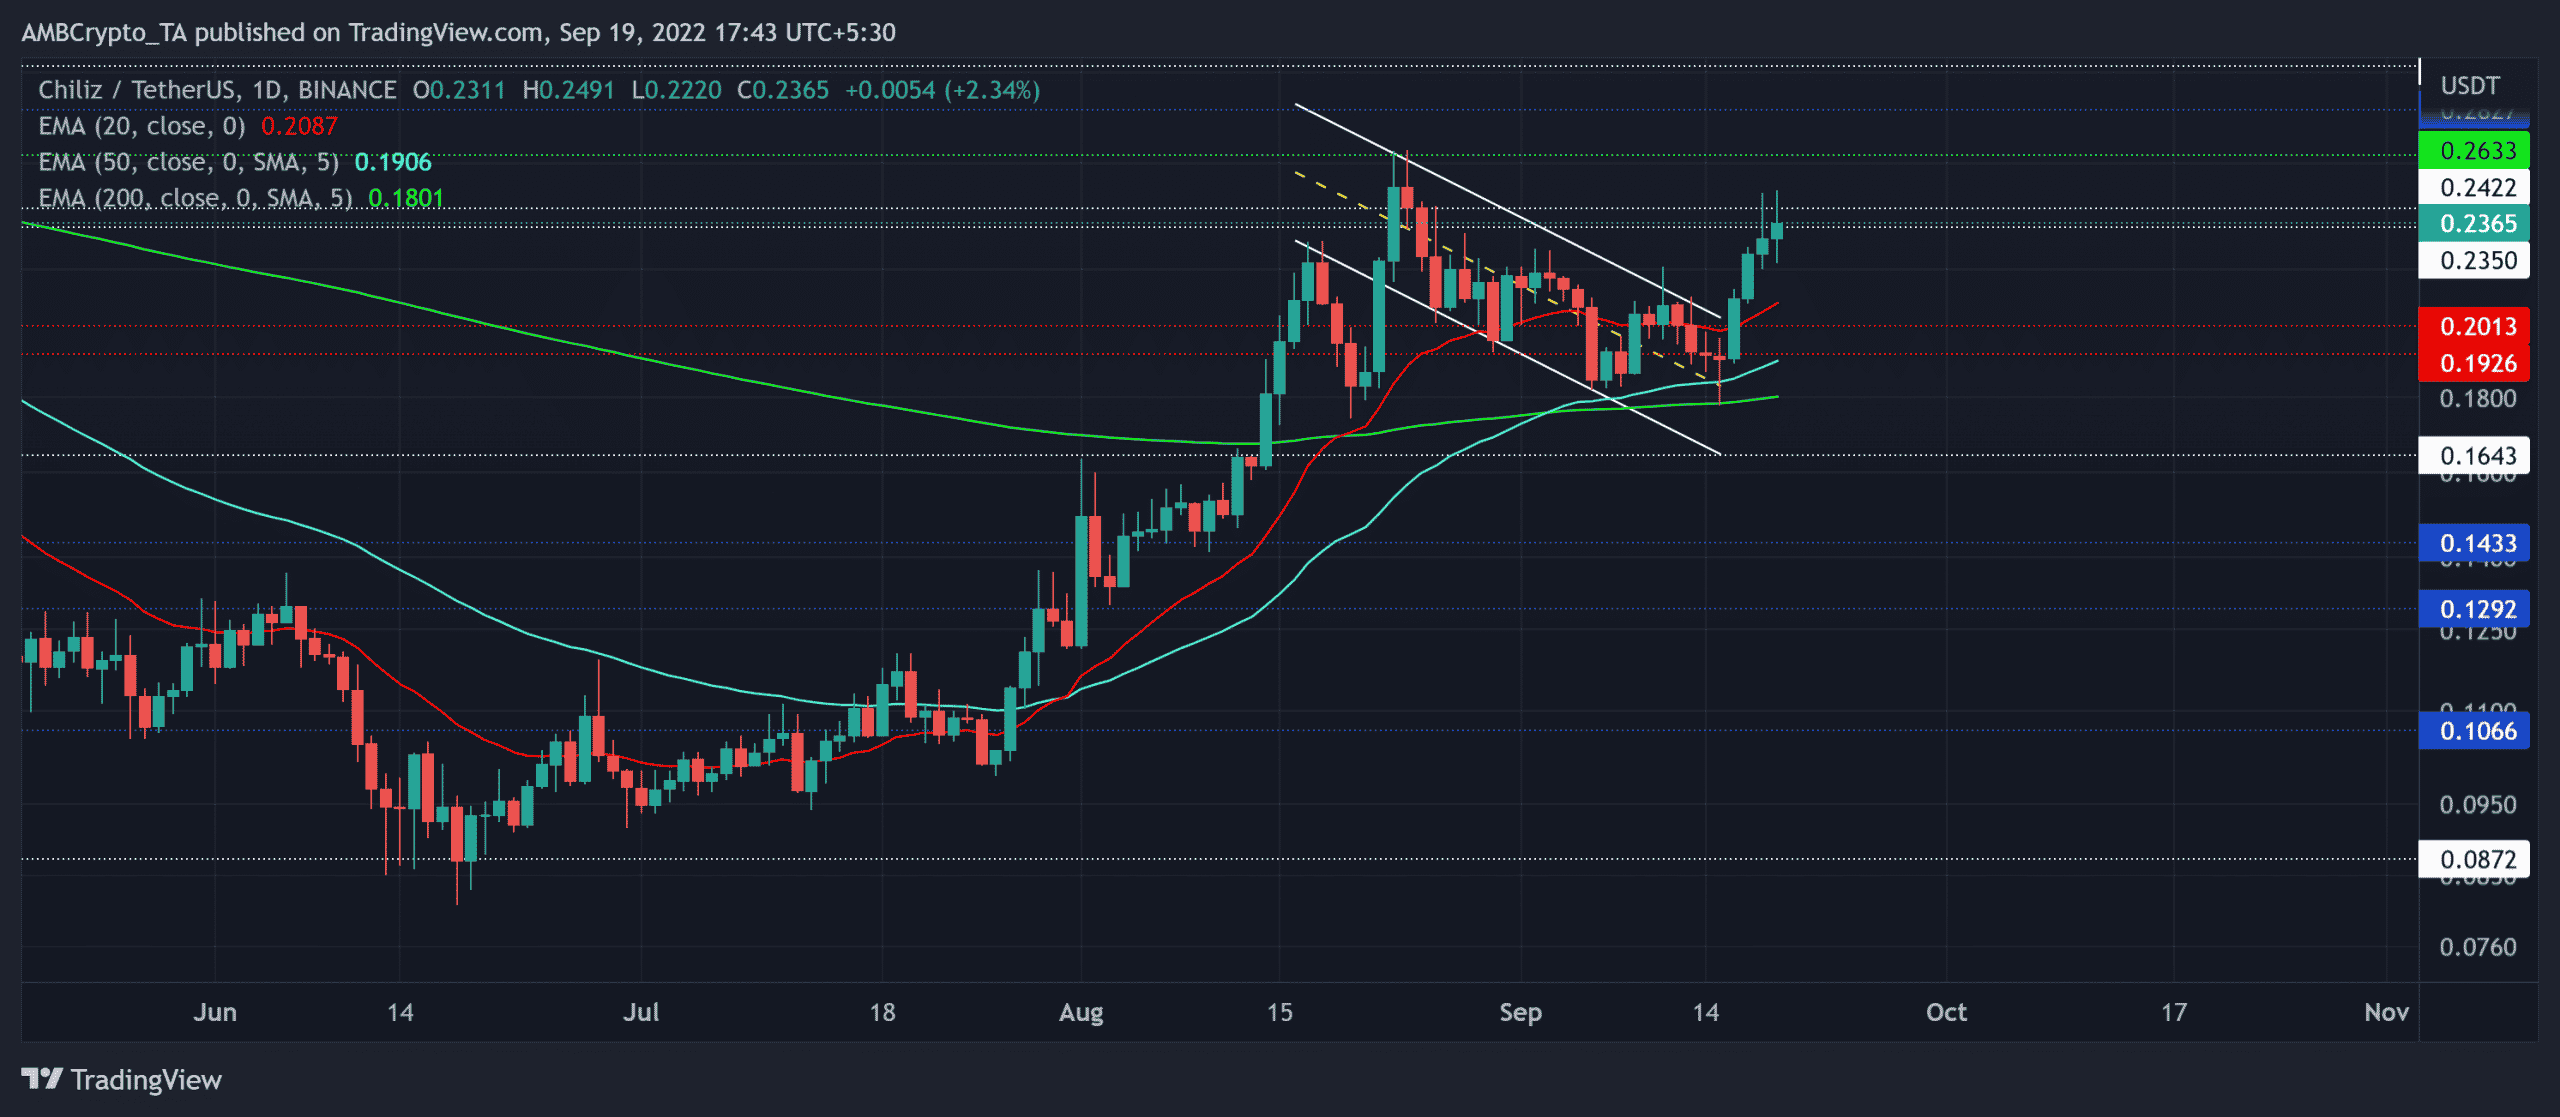
Chiliz’s [CHZ] recovery from the $0.08 baseline orchestrated a bull rally, one that propelled the coin beyond the bonds of its 20/50/200 EMA. While fixating a spot above these hurdles, CHZ marked an expected breakout from its bullish pattern on the daily chart.
With the north-looking 50 EMA (cyan) gliding above the 200 EMA (green), buyers could seek to expedite their advantage in the coming times.
But the broader market sentiment seemed to deteriorate. Thus, the buyers should look for the entry triggers discussed below before placing calls.
At press time, CHZ was trading at $0.2365, down by 2.06% in the last 24 hours.
CHZ Daily Chart
The bulls found enough firepower to impose a consistent streak of higher peaks and troughs over the last few weeks. The recovery from the $0.08 level entailed a staggering 215% ROI until CHZ poked its four-month high on 23 August.
The decline from this level chalked out a classic descending channel on this timeframe. The resultant breakout has positioned the coin for a near-term upside.
A compelling close above the $0.23-$0.24 range could aid the alt in retesting the $0.263-$0.28 range in the coming sessions. But a reversal below the $0.23 region could hinder the bullish progress.
Meanwhile, the golden cross on the 50 EMA (cyan) with the 200 EMA can set a solid foundation for the altcoin’s long-term growth. Also, the near-term retracements would continue to find rebounding grounds from the $0.19-$0.2 range.
Rationale
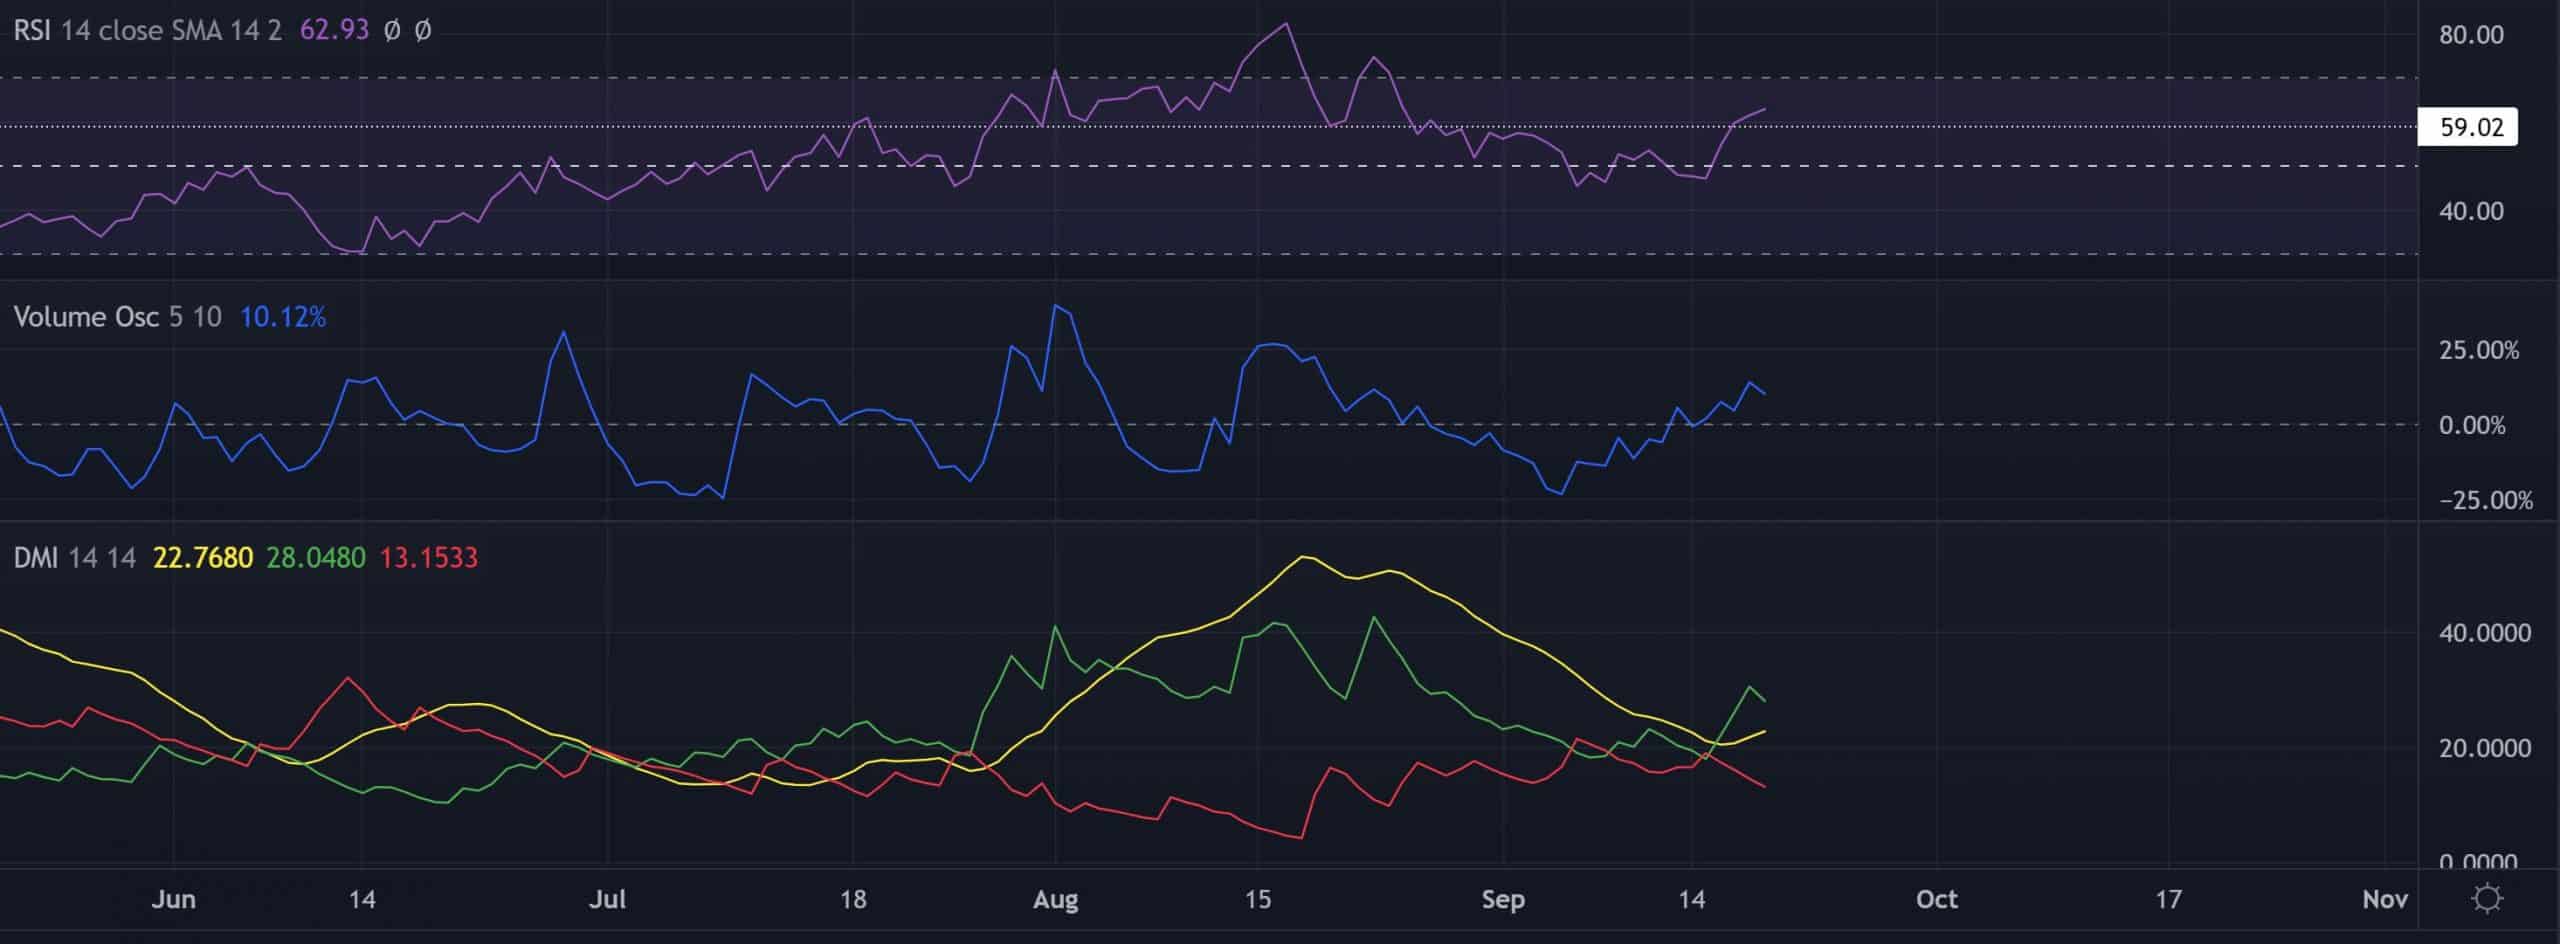
The Relative Strength Index (RSI) took a bullish position while finally breaking above the 59-support. A continued sway above this threshold would aid the buyers in finding fresher highs on the chart.
Further, the Volume Oscillator (VO) marked higher peaks during the recent gains. This reading hinted at a relatively strong bullish move in the last few days.
Finally, the DMI lines unveiled bullish inclinations but the ADX struggled to affirm a strong directional trend.
Conclusion
Given the down-channel breakout alongside the golden cross of the 50/200 EMA, the buyers could aim to strive for more in the coming sessions.
A close below the 20 EMA could invalidate the buying inclinations. The potential targets would remain the same as above.
Finally, traders/investors should keep a close watch on Bitcoin’s movement and its effects on the wider market to make a profitable move.


