Dogecoin, Avalanche, Bitcoin Cash Price Analysis: 25 December

Dogecoin showed promising reversal signs as it crossed the $0.182-mark depicting a strong bullish influence. Avalanche saw a setback below the 23.6% Fibonacci level but managed to form a bullish divergence on its 4-hour chart.
On the other hand, Bitcoin cash reclaimed the $446 near-term support but did not display a powerful directional trend.
Dogecoin (DOGE)
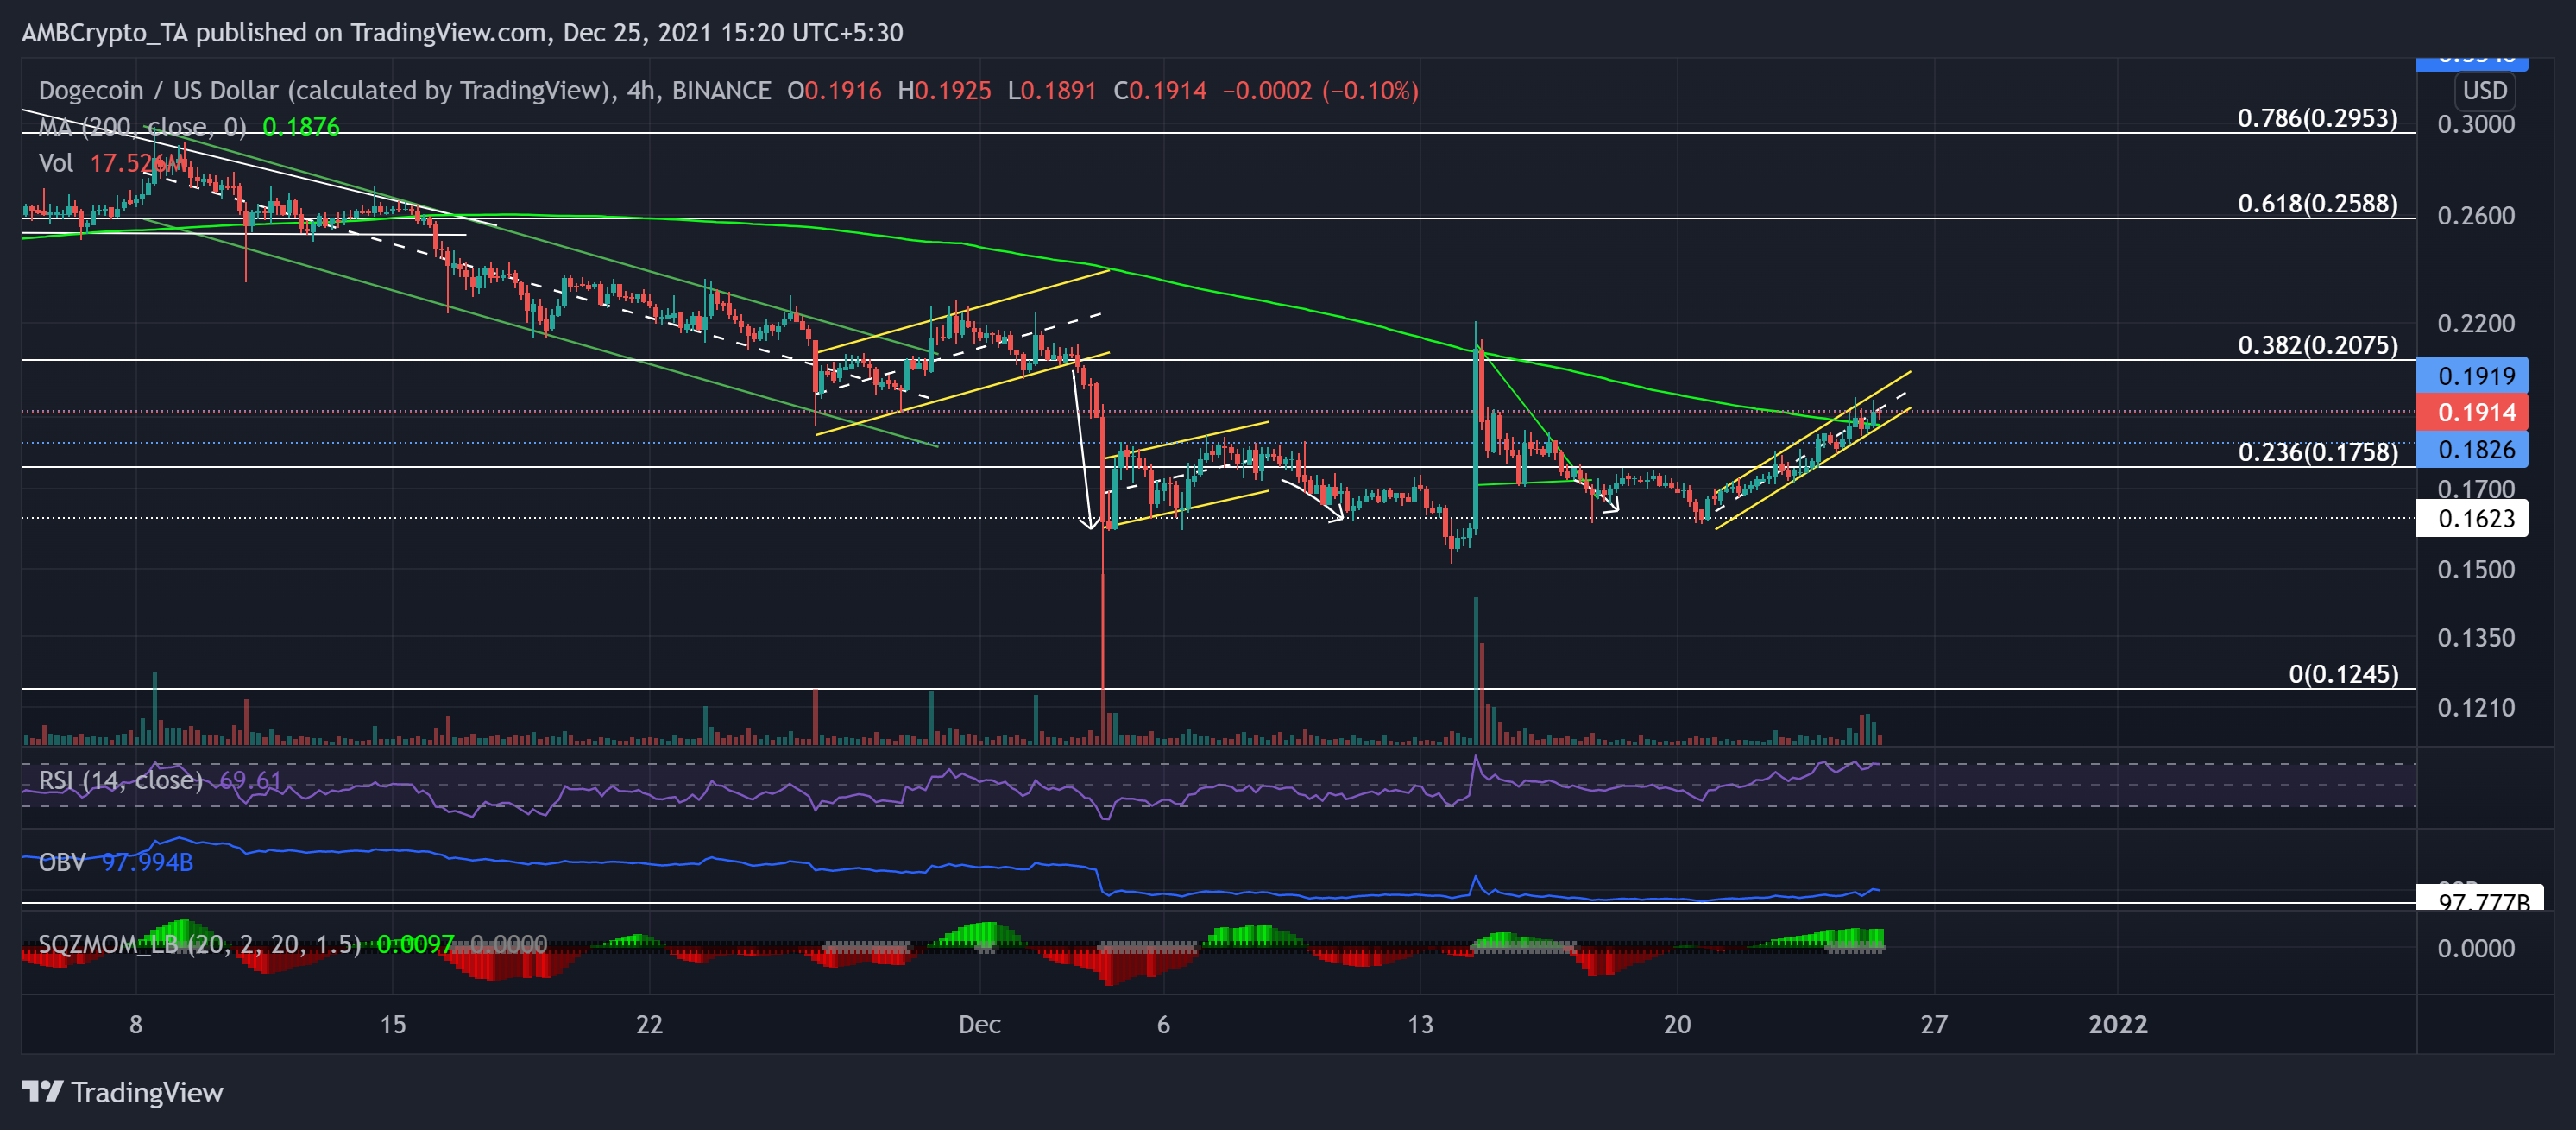
Over the past day, DOGE bulls tested the $0.1826-mark twice after crossing the 23.6% Fibonacci resistance. The bulls seemingly gained thrust as the alt noted an 18.3% five-day gain (from 20 December low). This upturn marked an up-channel (yellow) on its 4-hour chart.
DOGE continued to find support at the lower channel that concurred with the 200-SMA (green). Now, the meme-coin tested the $0.1919-mark (three-week resistance) and saw a slight pullback. The trading volumes and OBV saw a corresponding spike, hinting at a healthy trend reversal.
At press time, DOGE traded at $0.1914. The RSI poked the overbought region for the third time in the last two days, depicting a strong bullish influence.
The Squeeze Momentum Indicator flashed grey dots, hinting at a high volatility phase. Nevertheless, keeping in mind the overbought RSI threat, it might see a near-term setback.
Avalanche (AVAX)
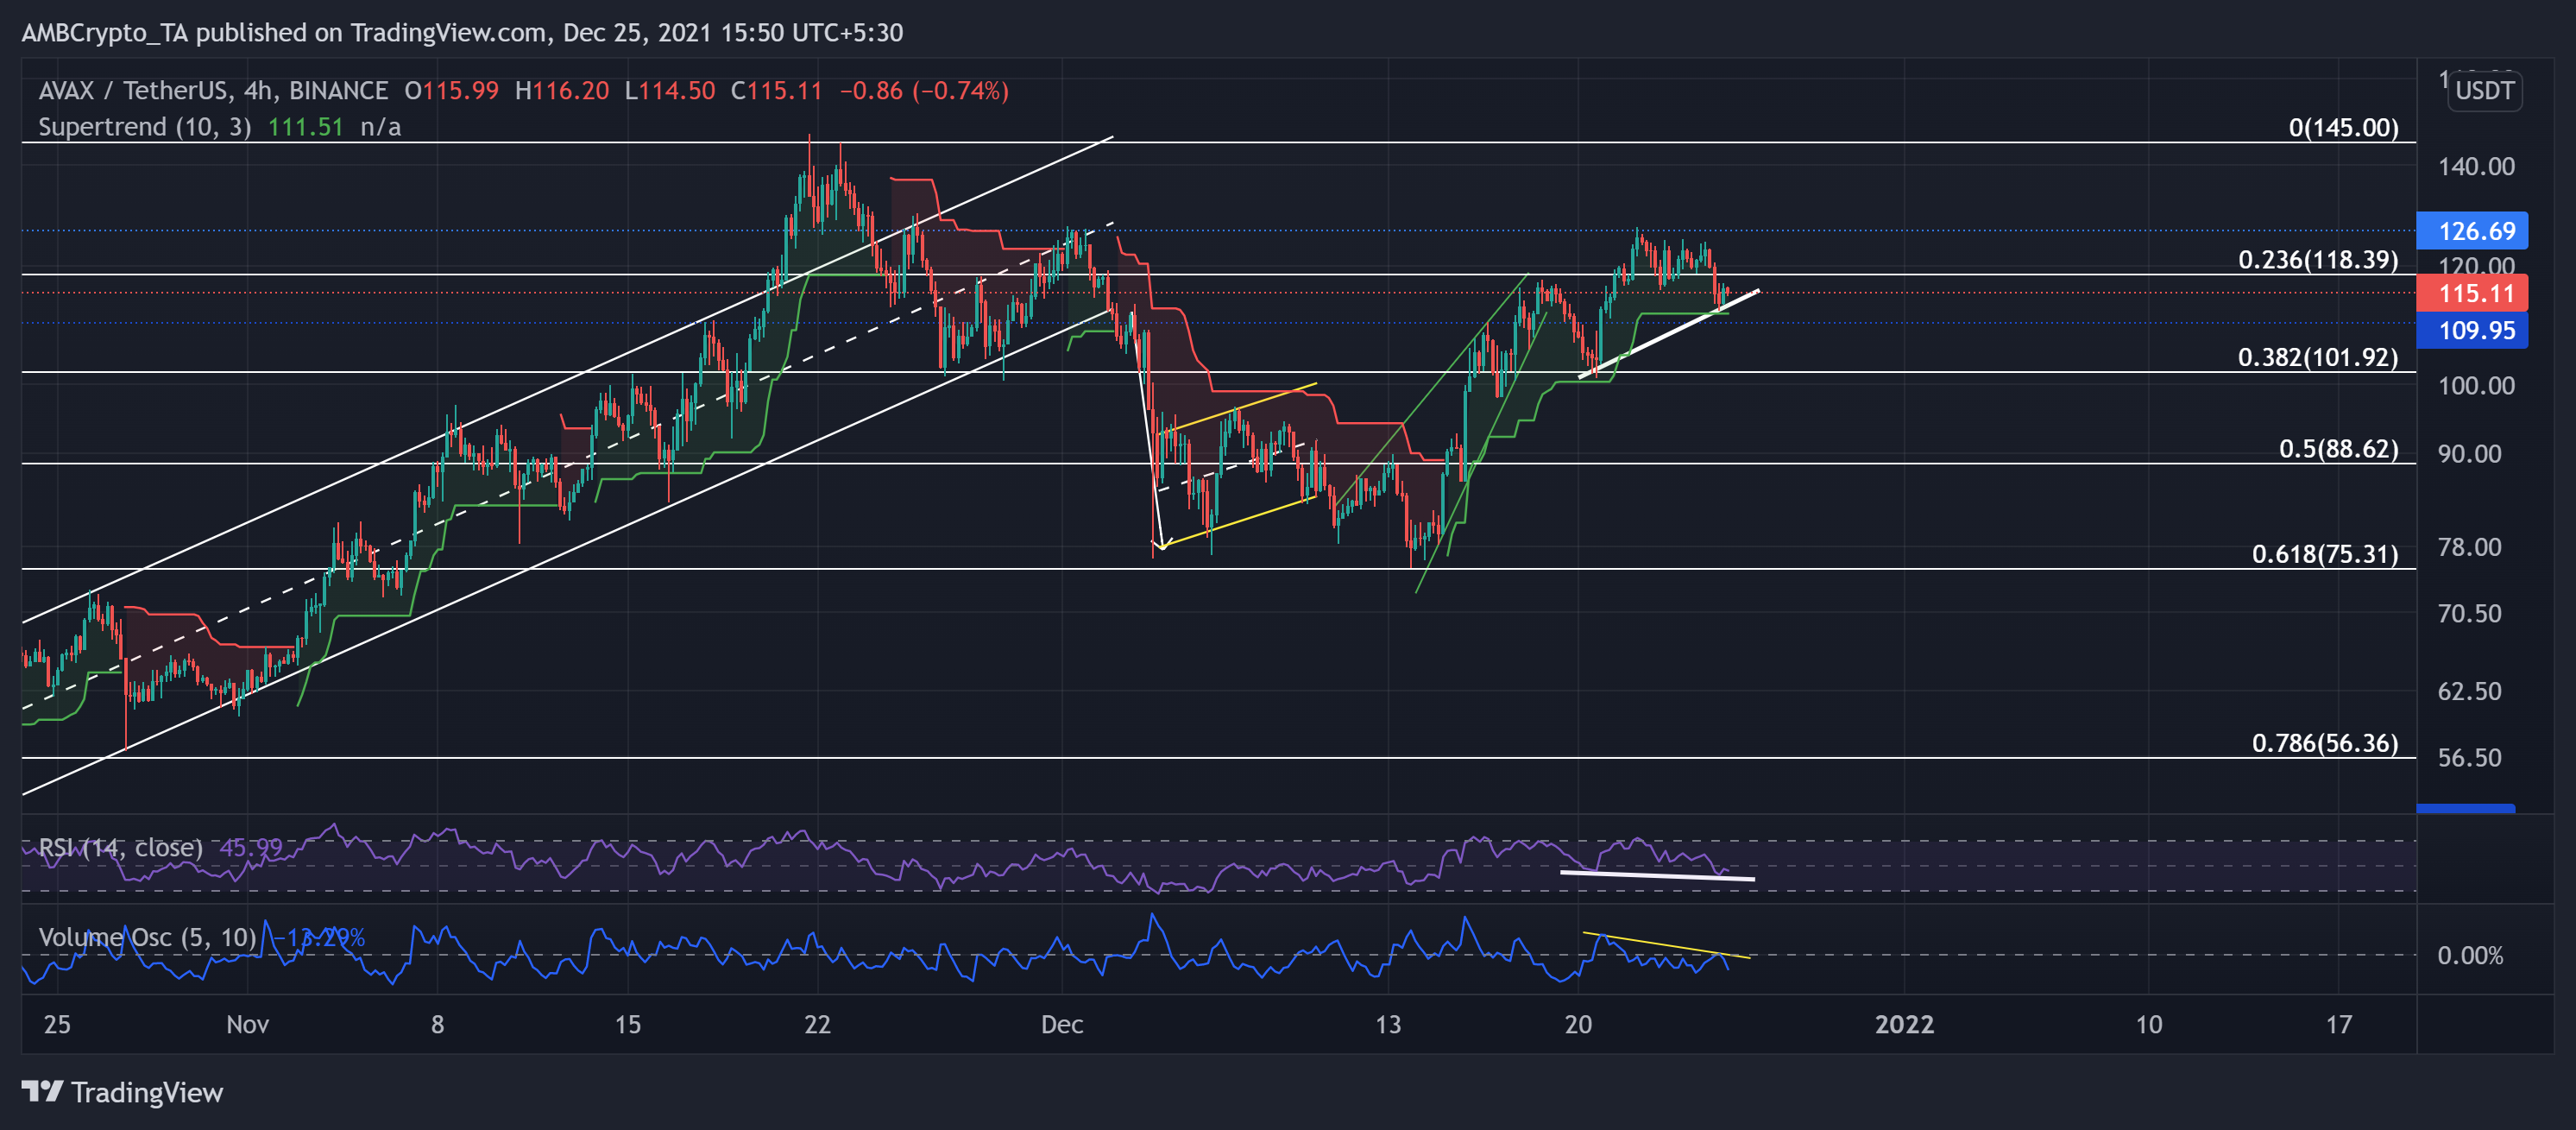
AVAX registered a monstrous 52.48% ROI from the 13 December low after finding strong support at the golden Fibonacci point.
The digital currency saw an expected rising wedge breakdown but found support at the 38.2% Fibonacci mark. As a result, the alt saw a v-shaped recovery over the past two days but saw resistance at the $126-mark. Bears tested the 23.6% support four times until they finally breached it on 25 December.
Any further retracements would find testing support at the $109-mark followed by the 38.2% Fibonacci level. At press time, AVAX traded at $115.11 after noting a 6.5% 24-hour loss.
The RSI dipped below the half-line after showing weak signs. Further, the Volume Oscillator too marked lower lows. However, the bullish divergence between the RSI and price action (white) and the Supertrend readings keep the hope alive for AVAX investors.
Bitcoin Cash (BCH)
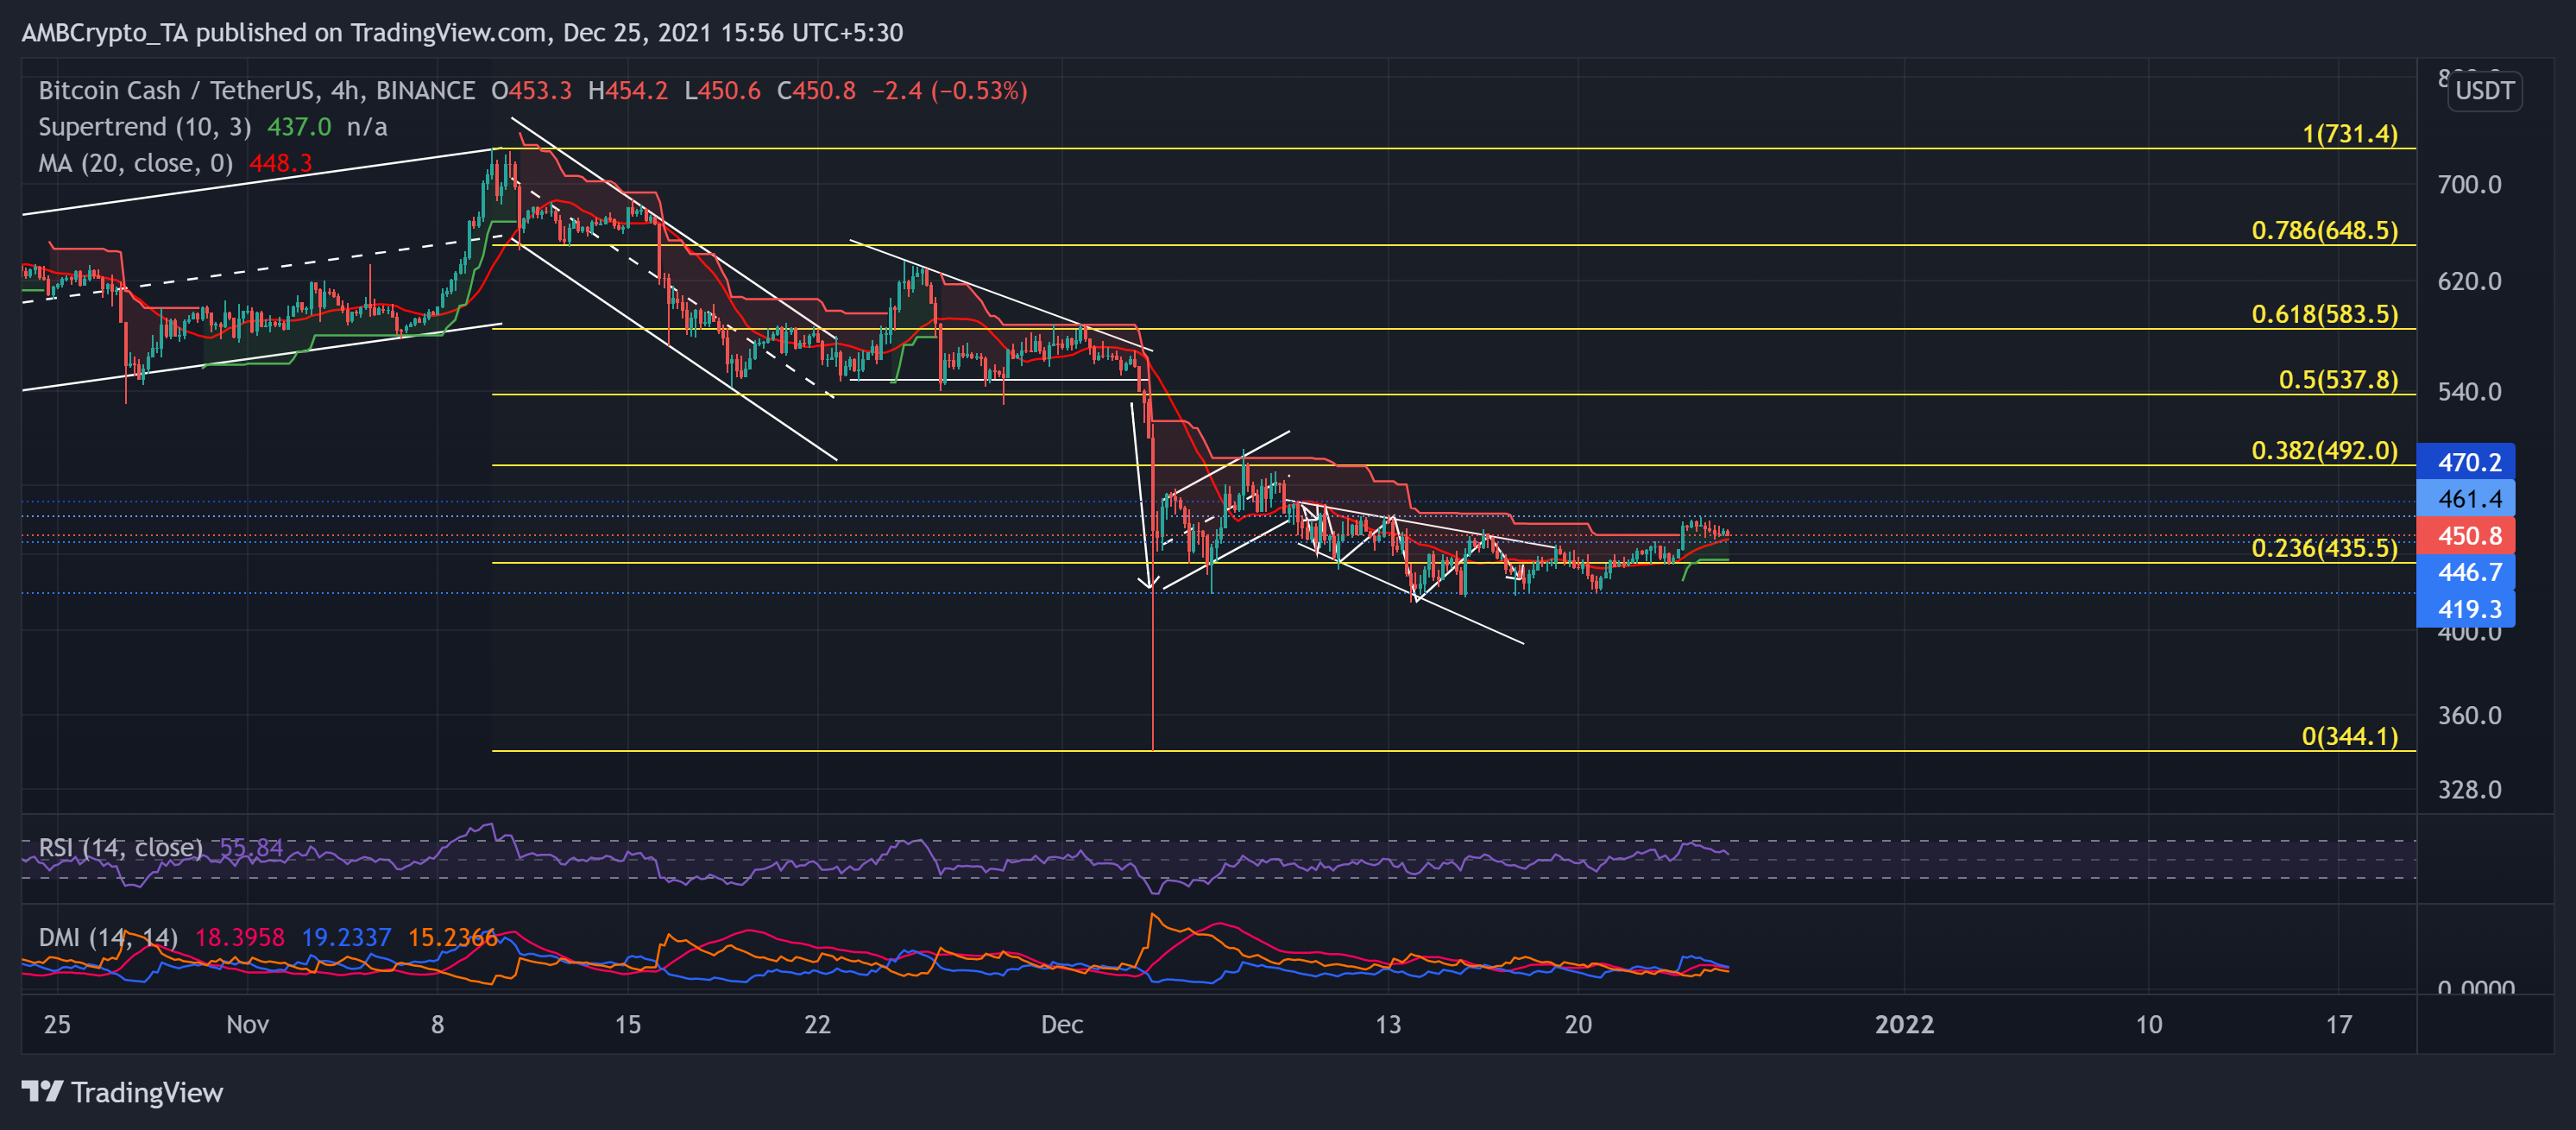
After forming a descending broadening wedge (reversal pattern) on its 4-hour chart, the altcoin saw an expected breakout above the 23.6% Fibonacci level. The bulls were keen on holding their ground at the 419-mark while bears retested it multiple times.
The alt saw a 9.07% jump (20 December low) but saw a pullback from its near-term resistance at the $461-mark. Now, BCH found support near the 20 SMA (red) at the $446-mark. Meanwhile, the Supertrend flashed a buy signal after a long time.
At press time, the alt traded at $450.8. The RSI stood at the 56-mark after flashing an uptrend. Further, the DMI also exhibited a bullish preference. But the ADX showed a slightly weak directional trend.