EOS, Ethereum Classic, MATIC Price Analysis: 03 July

EOS did not recover significantly over the last ten days, noting a decline of 18.77% in its trading volume over the last 24 hours instead. Market bears were still active as the alt struggled to move past its $4.18 resistance level.
Ethereum Classic gained by 43.20% over the last week and at press time, the altcoin was consolidating between its support and resistance levels. Finally, MATIC registered an uptick after going on a downward trend after 30 June.
EOS
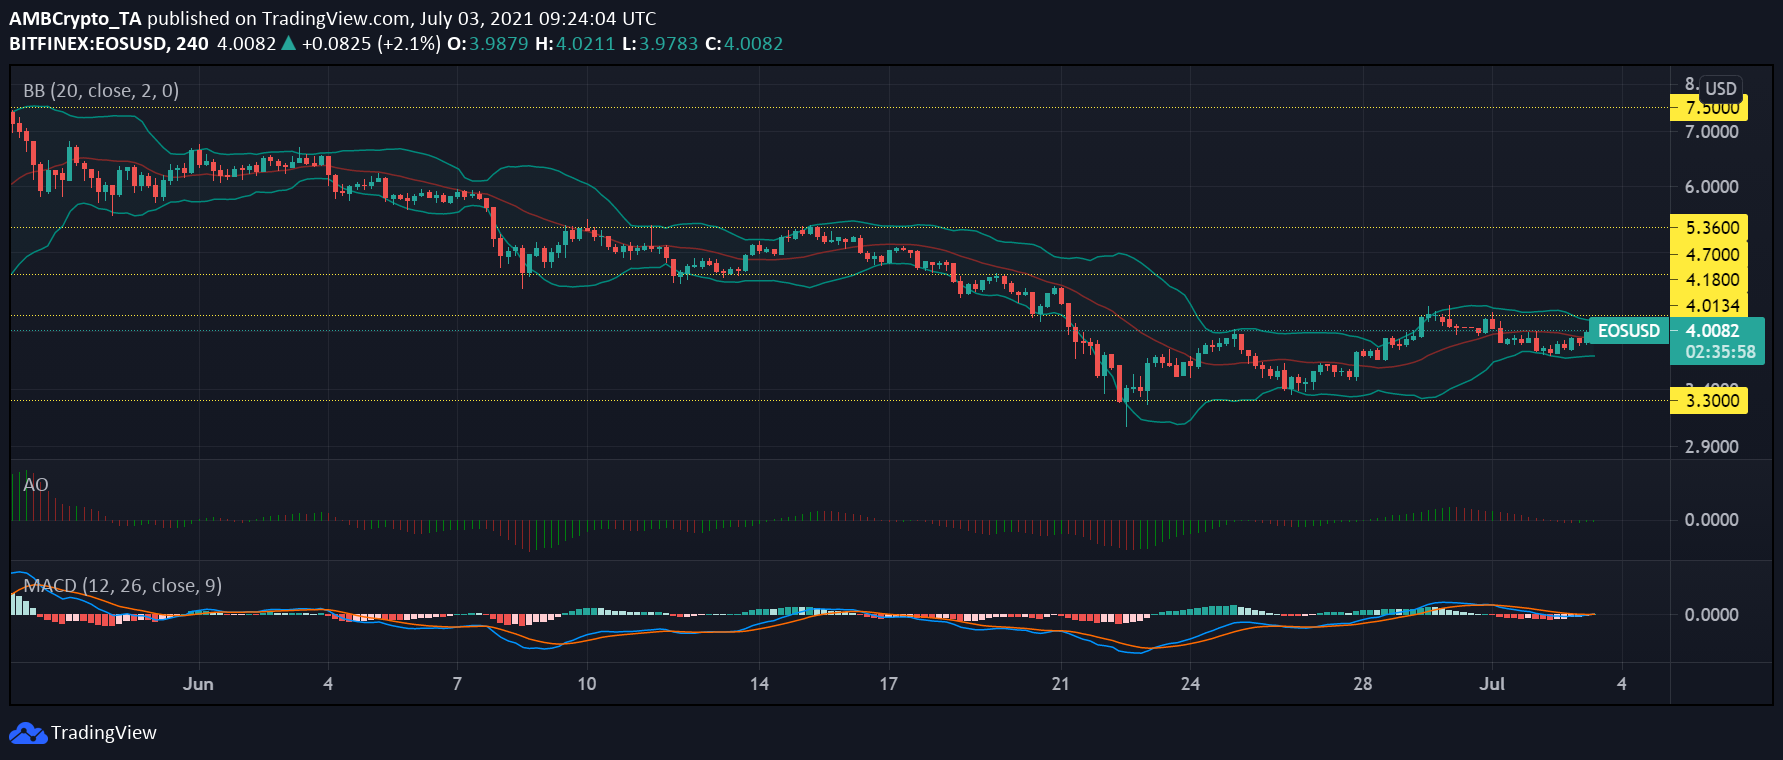
EOS was trading at $4.01, at the time of writing, while not much changed for this alt over the last week. The coin was moving between the $3.3 support and $4.18 resistance. It tried to break past its immediate resistance of $4.18, but could not succeed. However, considering the 5.1% hike in its price over the last 24 hours, EOS could soon leave the $3.30 support level well behind.
The Awesome Oscillator underlined a short-term bullish force. However, if the alt fails to move past the $4.18 resistance level, bullish momentum could die out. On 1 July, the MACD indicator registered a bearish crossover.
With respect to price fluctuations, the Bollinger Bands remained narrow and projected that EOS may see restricted price movement going forward.
Ethereum Classic [ETC]
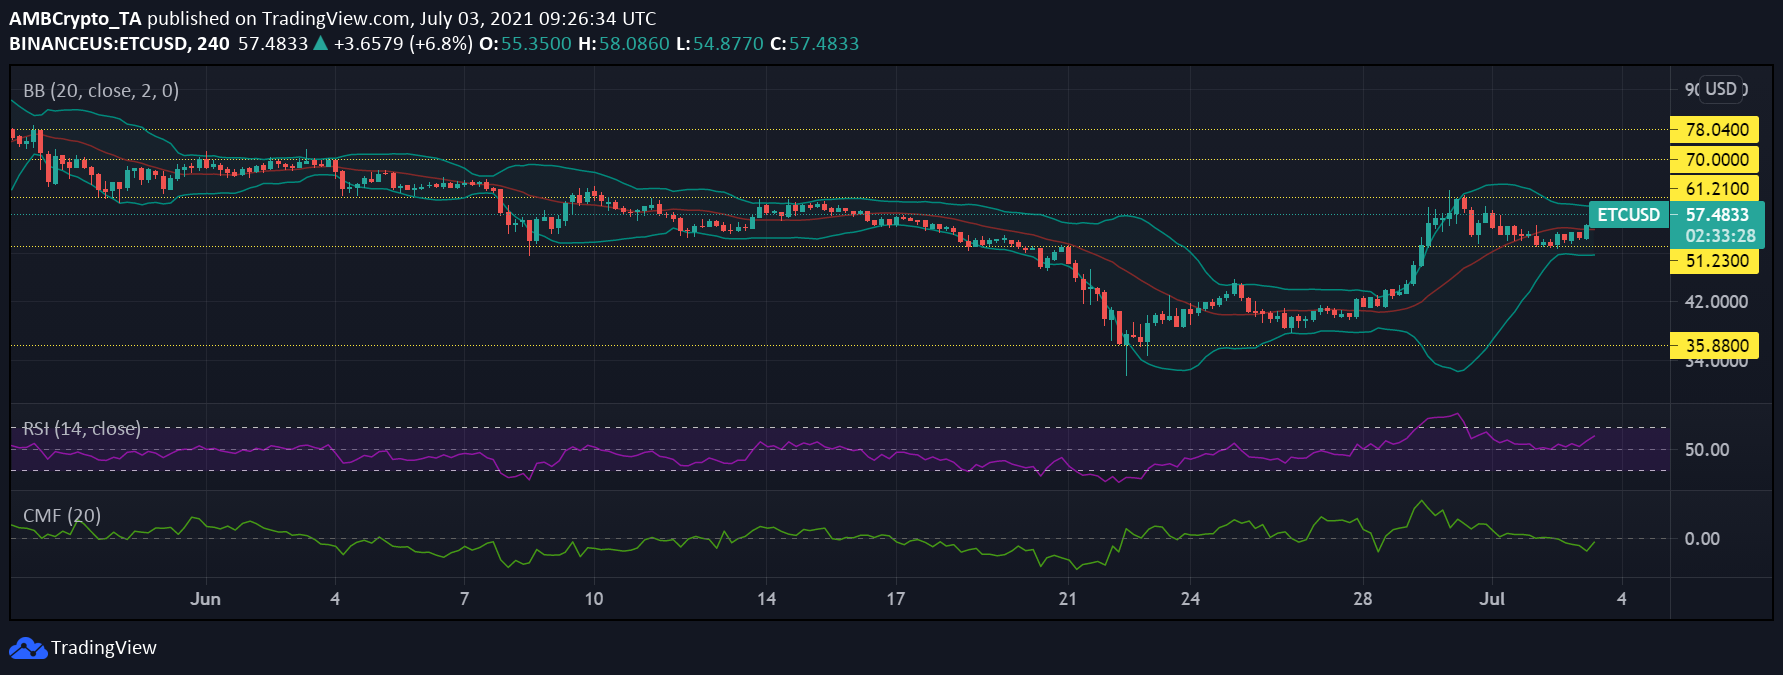
Ethereum Classic registered gains worth 9.9% over the last 24 hours and a substantial 43.2% hike over the last 7 days. Price movement has been choppy lately, however. At press time, the altcoin was valued at $57.48 and was trading in the green.
After the coin recovered its levels, its momentum started to fade somewhat. If ETC moves past consolidation between its immediate support and resistance levels, the next resistance level would be at $61.21.
The Bollinger Bands remained parallel and pointed to further sideways price movement as the bands did not demonstrate any convergence or divergence. The Relative Strength Index projected an increase in buying pressure as the indicator moved north from the neutral zone.
Since the beginning of July, ETC has seen an increase in capital outflows. At press time, however, it noted a slight uptick in capital inflows, as pictured by the Chaikin Money Flow.
Polygon [MATIC]
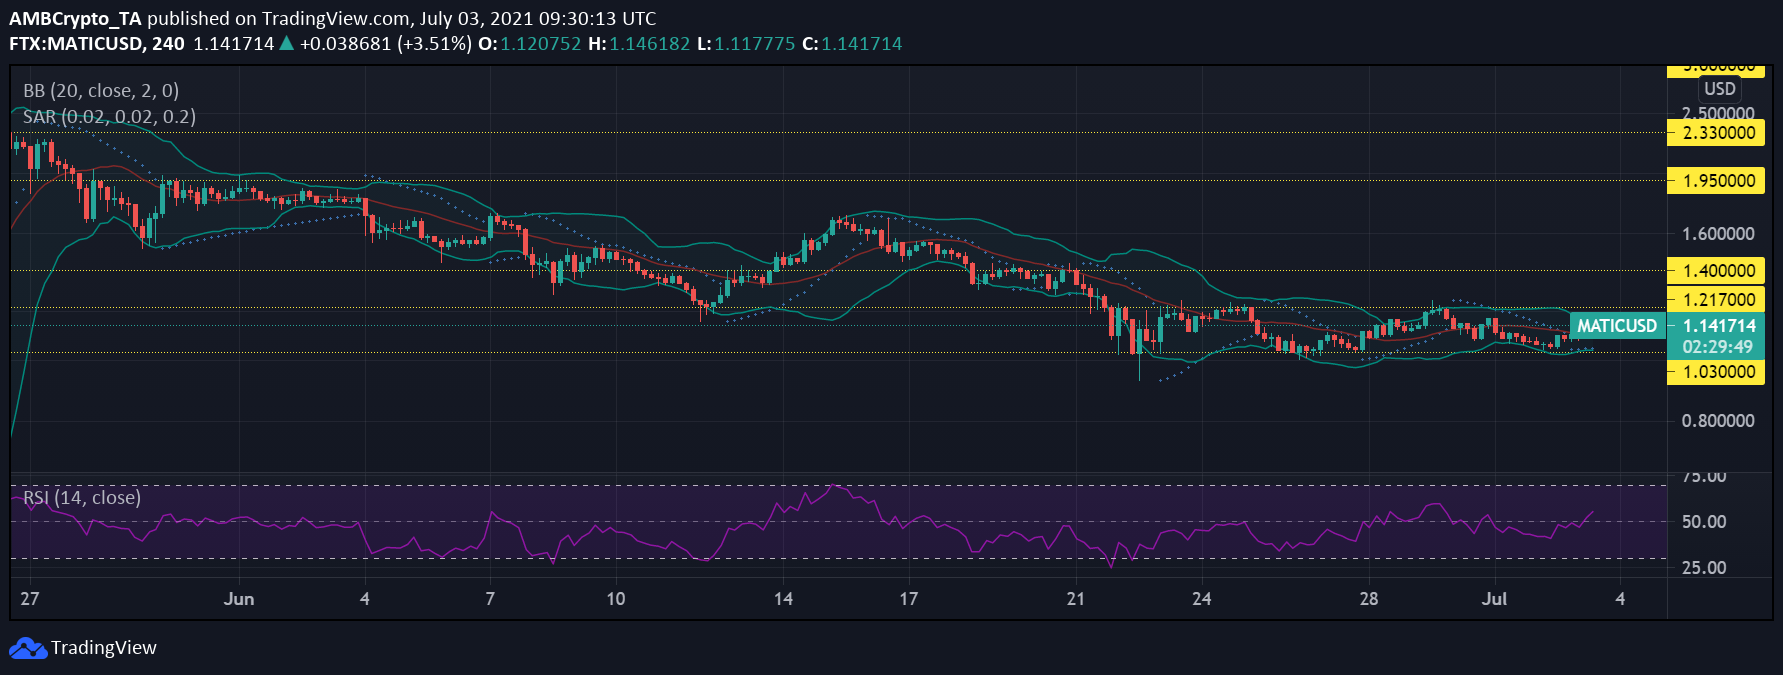
MATIC witnessed a week of directionless movement as the alt’s price could not break past its immediate resistance level. At the time of writing, the alt was priced at $1.14. If the price fails to sustain its movement, despite daily gains, MATIC could fall below $1.00.
The Bollinger Bands for MATIC diverged, indicating that market volatility could increase. The Parabolic SAR’s dotted line hovered below the candlesticks as the coin registered a hike in its price over the last 24 hours.
The Relative Strength Index moved above the neutral line as selling pressure shrunk and buying pressure mounted. Its upward movement suggested that buyers were exceeding sellers in the market.