
As the king coin fell by 13% on the charts, the market’s alts followed its lead. Ethereum, for instance, lost 13% of its value in just two days, with ETH noting slight signs of recovery at press time Likewise, Cardano [ADA] depreciated by 18.56% in seven days but was recovering somewhat. Finally, Solana hiked by 22% after the 21 June dip.
Ethereum [ETH]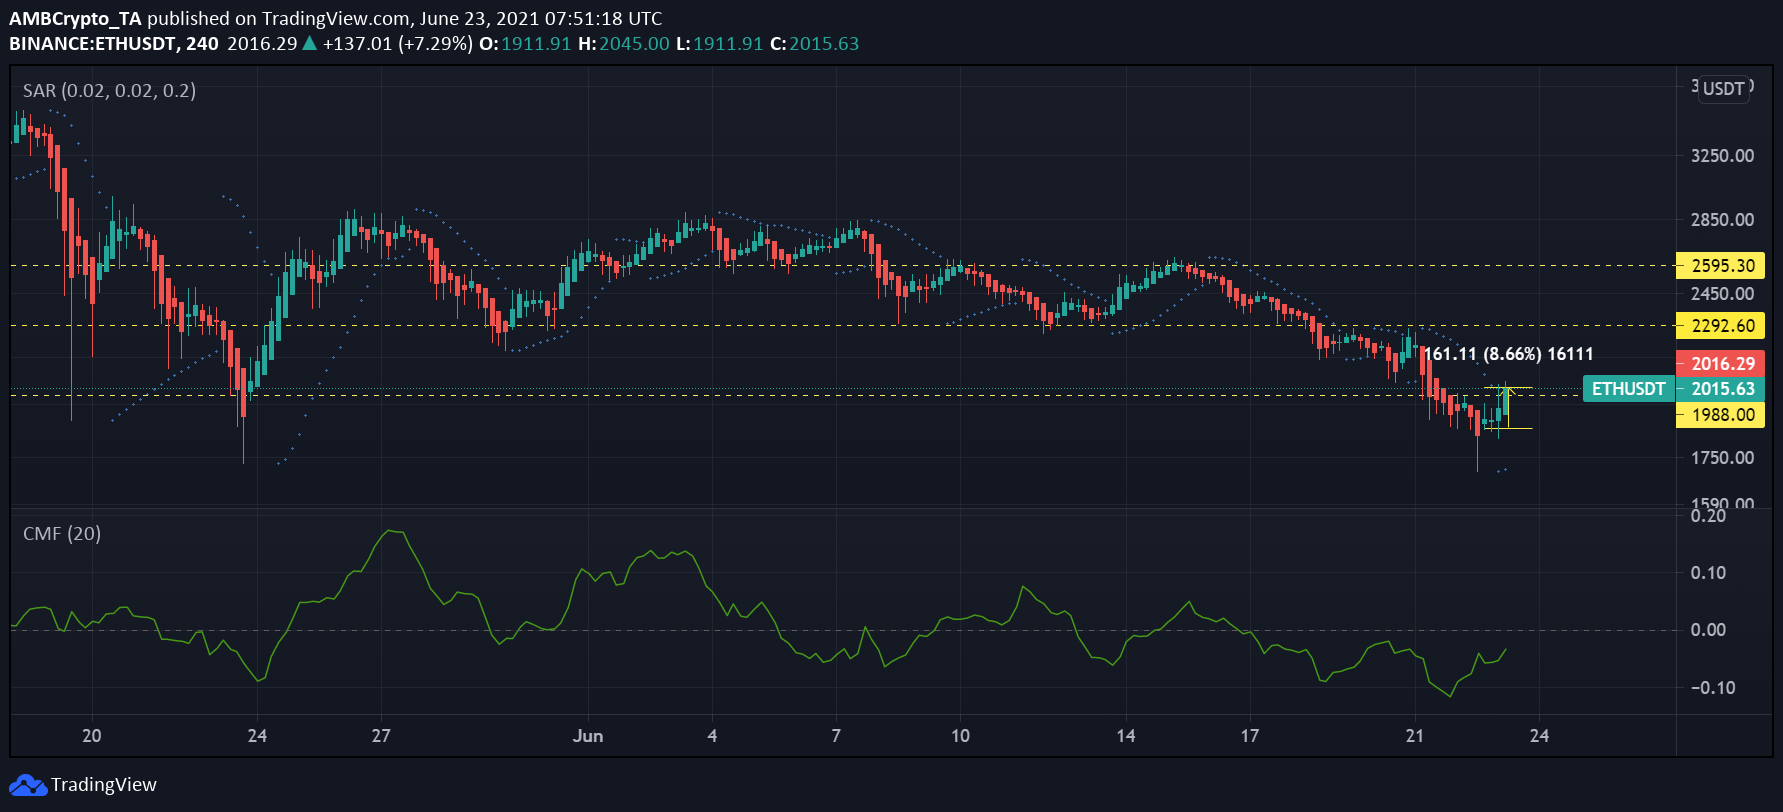 Source: ETH/USD – TradingView
Ethereum, the market’s king altcoin, after testing the $1,988 support on 21 June, fell below the same. However, it made a swift recovery in just one day as it again retested the $1988-level and flipped it back to support.
With the appearance of green candlesticks on the 4-hour chart of ETH, the prevailing trend was slightly bullish. This corresponded with the Parabolic SAR’s white dots that appeared below the candlesticks on the chart.
Further, capital inflows for the asset saw a slight hike as the indicator noted an uptick, at press time, according to the Chaikin Money Flow. The indicator has been below the zero-line for a while, keeping outflows dominant as it lingered in bearish territory. However, if the price hike continues, inflows might touch a net positive figure again.
Cardano [ADA]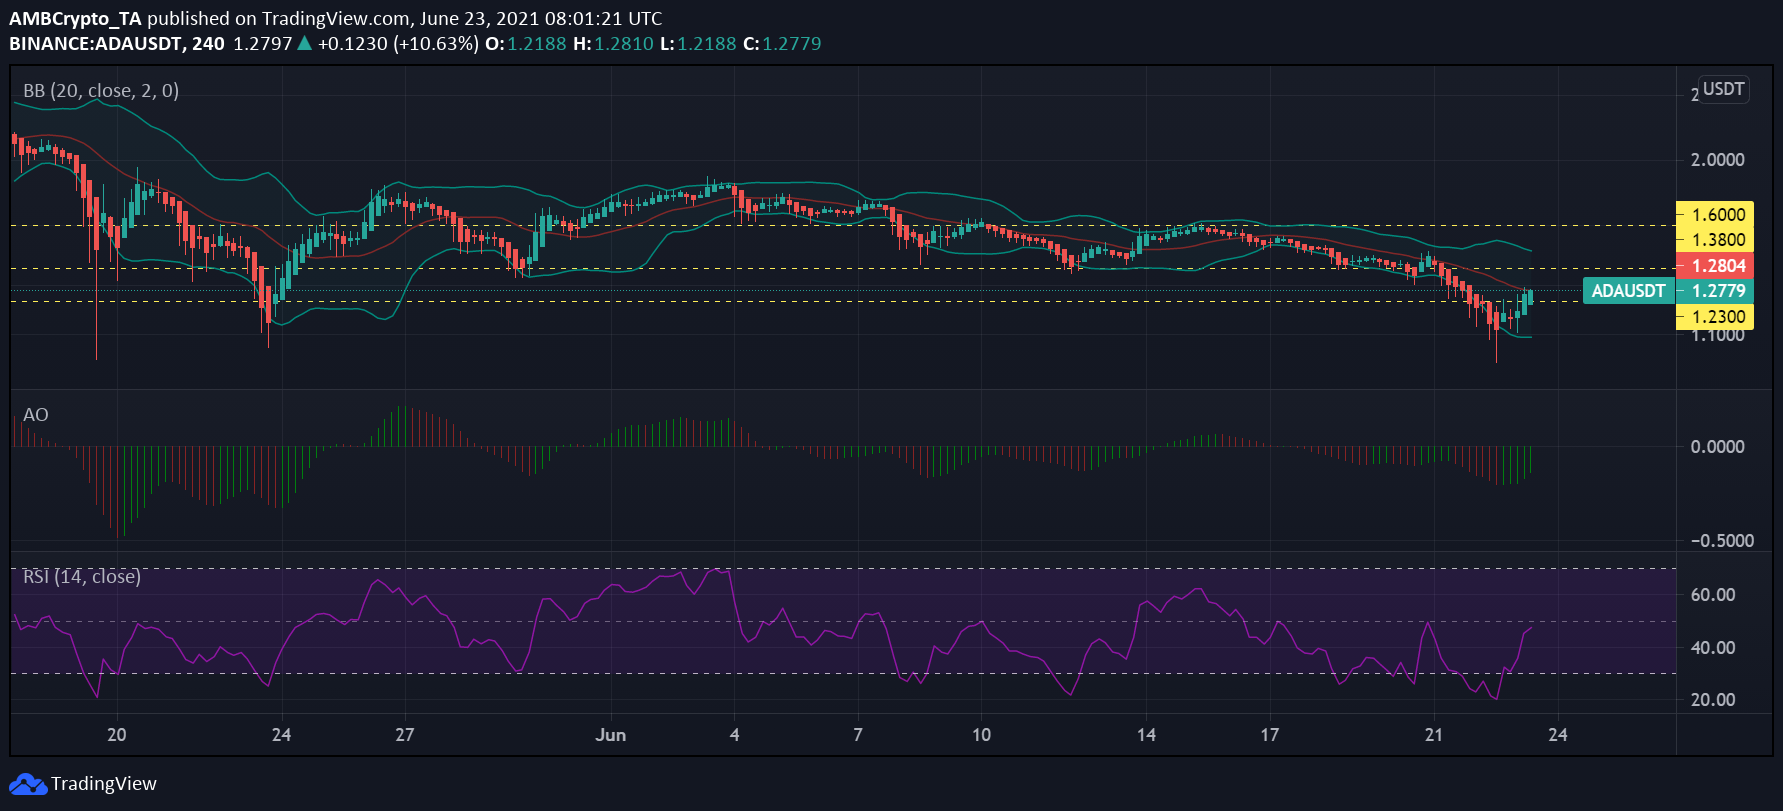 Source: ADA/USD – TradingView
ADA was trading at $1.27, at press time, after recovering from its fall under the key support level at $1.23. The press time resistance for the altcoin was $1.38, a level that can be tested if ADA’s price gain continues. The fifth-ranked alt noted a 7-day price fall of 18.04% whereas its 24-hour price saw a hike of 7.06%. Bullish momentum can be observed building on the Awesome Oscillator with the appearance of green bars.
Further, Bollinger Bands for the asset highlighted increased volatility and pointed to a more expanded price range as the asset recovered from its lower lows. The Relative Strength Index (RSI) for ADA was in the neutral zone and noted a figure of 47.7 at press time. While the RSI’s uptick highlighted an increase in buying pressure, buyers and sellers were equally dominant.
Solana [SOL]
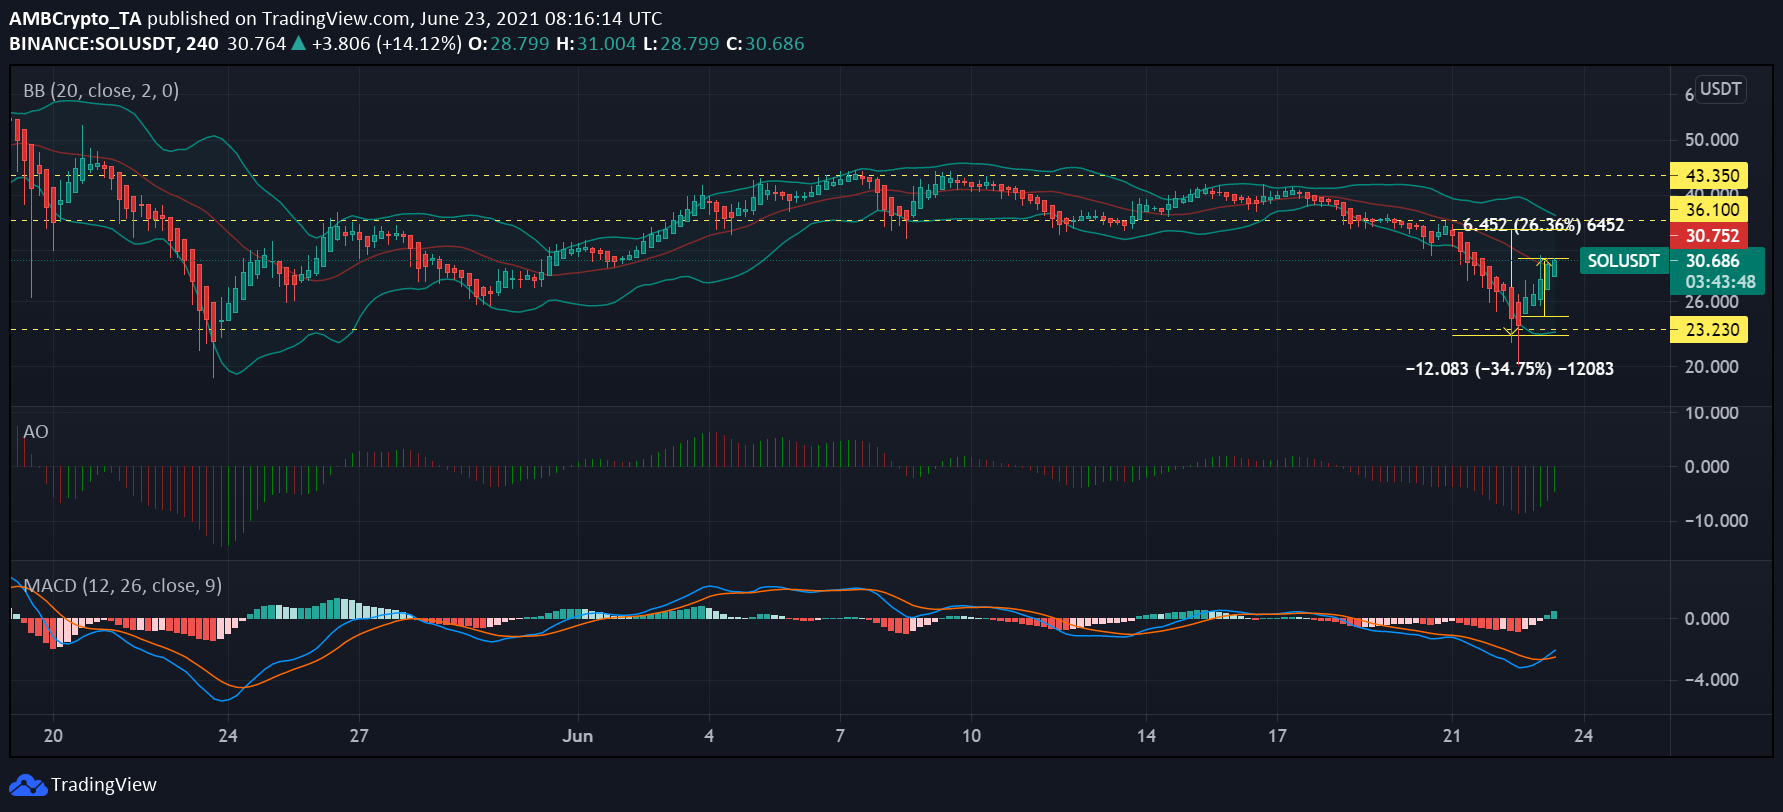
Source: SOL/USDT on TradingView
SOL breached its key support level at $36.1 on June 20 and oscillated close to the mark before registering a 34.7% price fall in just one day. On June 22, the asset breached its support at $23.23, however, it made fast recoveries from this fall. It was priced at $30.6, at the time of writing, and was down 47.42% from its ATH with a breakeven multiple of 1.90.
The altcoin recovered by almost 26% after the June 21 price fall as the Awesome Oscillator suggested that bullish momentum was building up on its 4-hour chart. Additionally, the slight convergence of the Bollinger Bands projected reduced price volatility and a comparatively restricted price range for the alt.
Finally, the MACD and Signal lines underwent a bullish crossover on June 23.


