Ethereum: Despite the Merge round-the-corner, ETH falls flat on these metrics

Since the massive plunge in June, Ethereum [ETH], the largest altcoin in the world, gained a steady northbound movement. Over the last two months, ETH has consistently registered higher lows, suggesting bullishness as the date of the much awaited Ethereum Merge comes closer.
However, in a recent turn of events, several cryptos, including Bitcoin [BTC] and Ethereum, suffered a price decline. At the time of writing, Ethereum was trading at $1,636.11, nearly 10% negative 24-hour growth, with a market capitalization of $199,662,199,532.
What’s happening
While the price plunged, several interesting developments happened on ETH’s on-chain metrics. Glassnode’s data indicated that Ethereum’s Exchange Outflow Volume (7d MA) just reached a one-month low of $14,564,884.80. This decline indicates a further plunge in ETH’s price in the coming days, as a decrease in outflow volume in exchanges is generally a bearish signal.
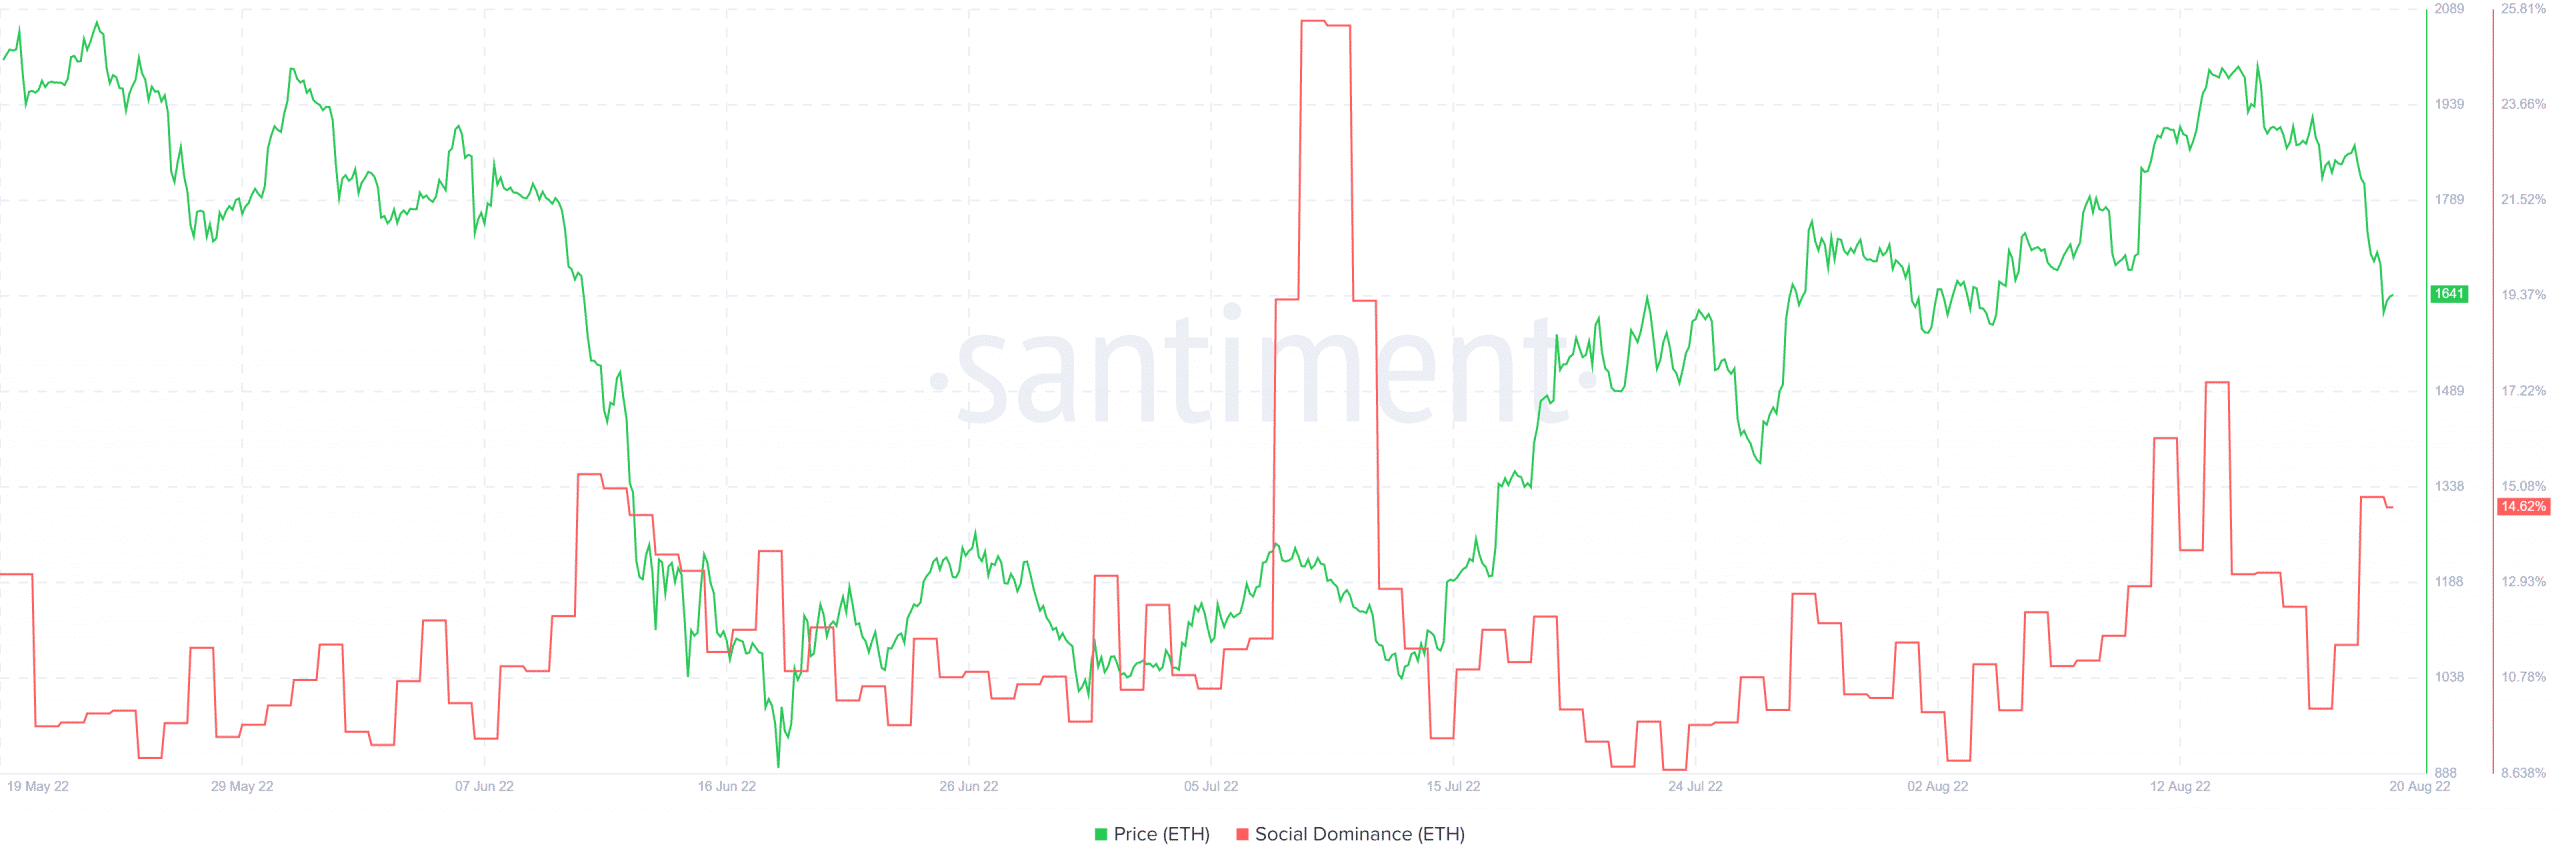
Additionally, as the outflow volume decreased, the inflow volume registered an increase, further establishing the possibility of a price decrease. While the price dropped, the social dominance of Ethereum moved upwards as the crypto community started talking about the episode on multiple social media platforms, voicing their opinions related to the same.
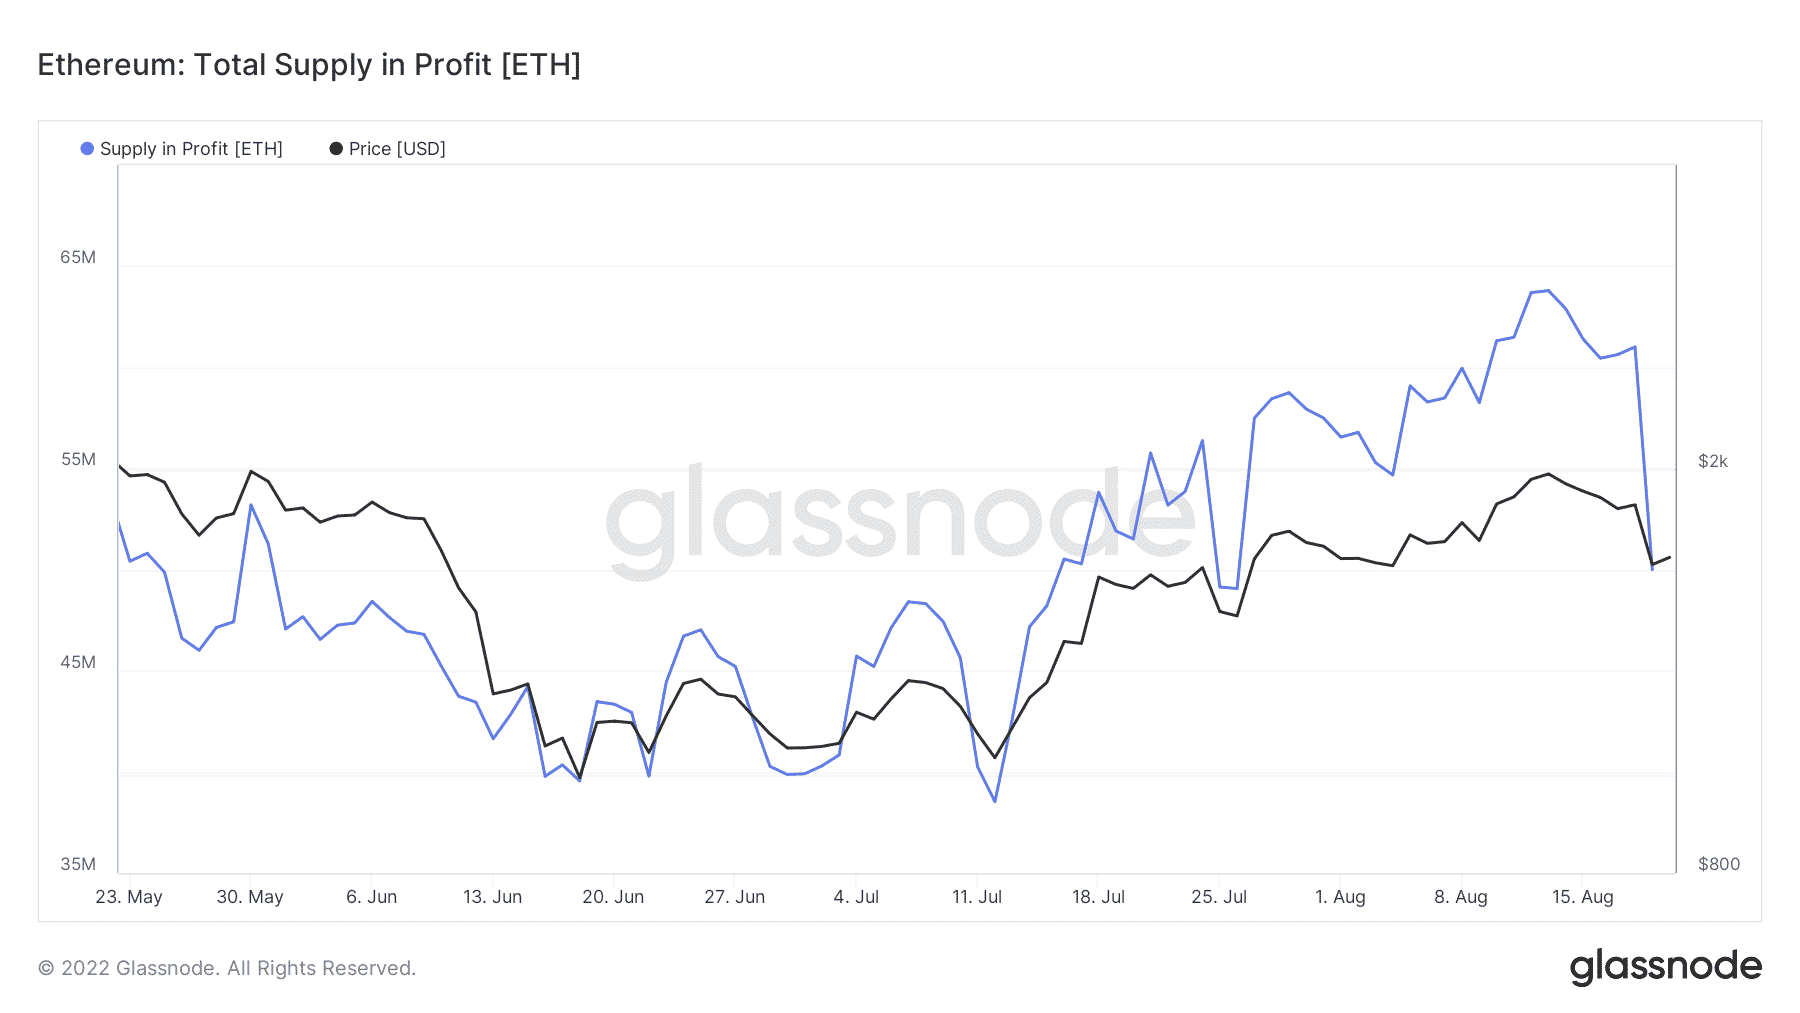
The price plunge was also accompanied by a decline in Ethereum’s supply in profit as it fell to 49,999,507 from 63,790.230, its three-month high in just a span of 24 hours, indicating higher investor losses.
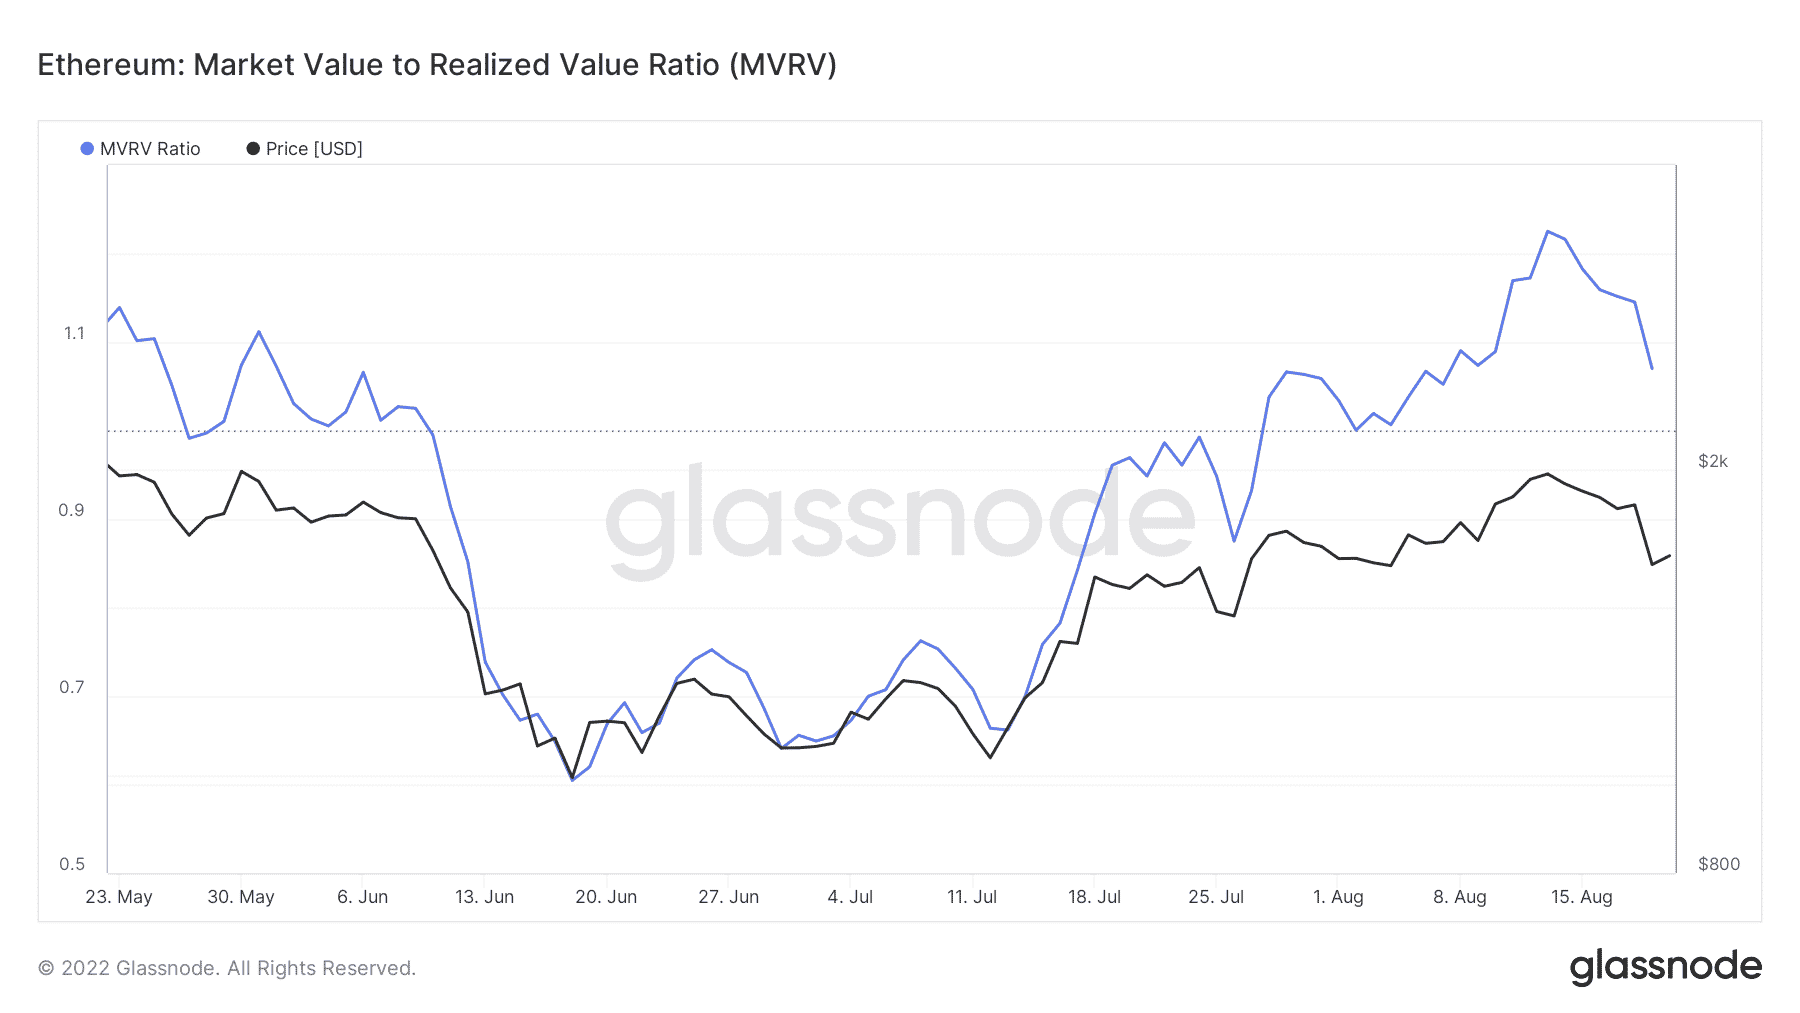
The Market Value Realized Value (MVRV) Ratio, which is an indicator of price actions, suggests Ethereum’s dark days are yet to continue. According to the graph, the MVRV Ratio was well above the one mark, indicating further price drops over the coming days as value under the one mark indicates a possible market bottom.
A look at the flip side
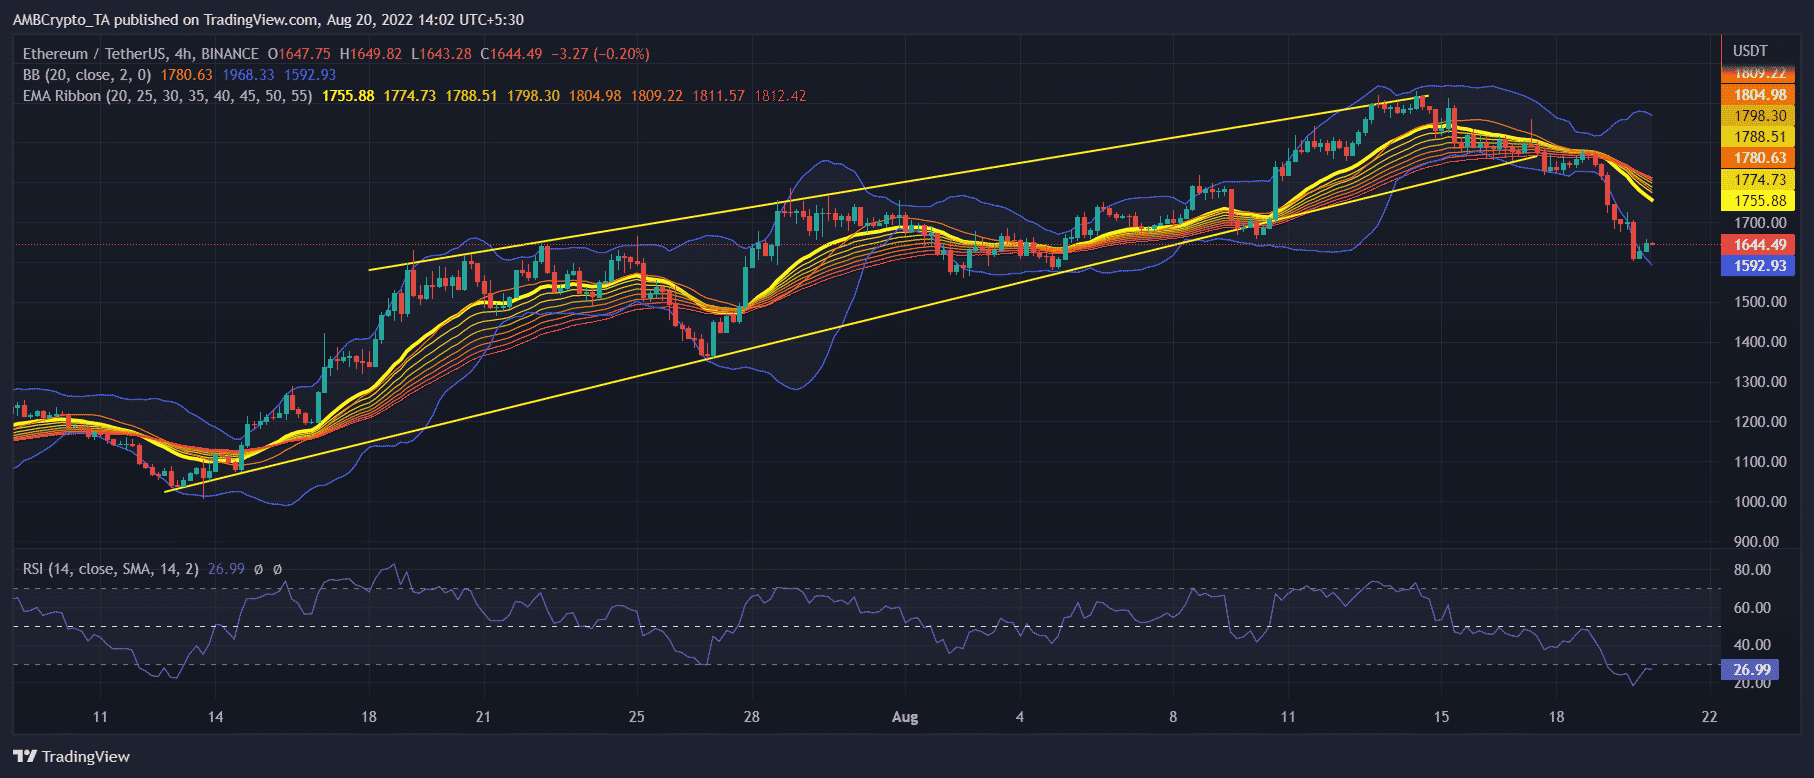
Though several metrics indicate a possible decline in ETH’s value, the four-hour chart also seemed to portray a grim picture. A bearish wedge pattern was formed on the chart that resulted in Ethereum’s price falling. As indicated by the Bollinger Bands (BB), ETH’s value was in a high volatility zone, suggesting a crunch in its price over the coming days.
The Relative Strength Index (RSI) pointed out that the decline in ETH’s price pushed it in the oversold zone. Therefore, a possibility arises that the price might gain an uptrend, showing new support at the $16,000 mark.