Ethereum, ICP, Filecoin Price Analysis: 11 January

Keeping the squabbles about the broader sell-off aside, ETH managed to keep its long-term 61.8% Fibonacci support intact. However, it still needed a compelling close above the 20 SMA on increased volumes to make way for a possible recovery.
Filecoin, on the other hand, continued its bearish outlook while staying below the 20-50-200 SMA. ICP flashed slowing tendencies with a 20-EMA support on its 4-hour chart.
Ethereum (ETH)
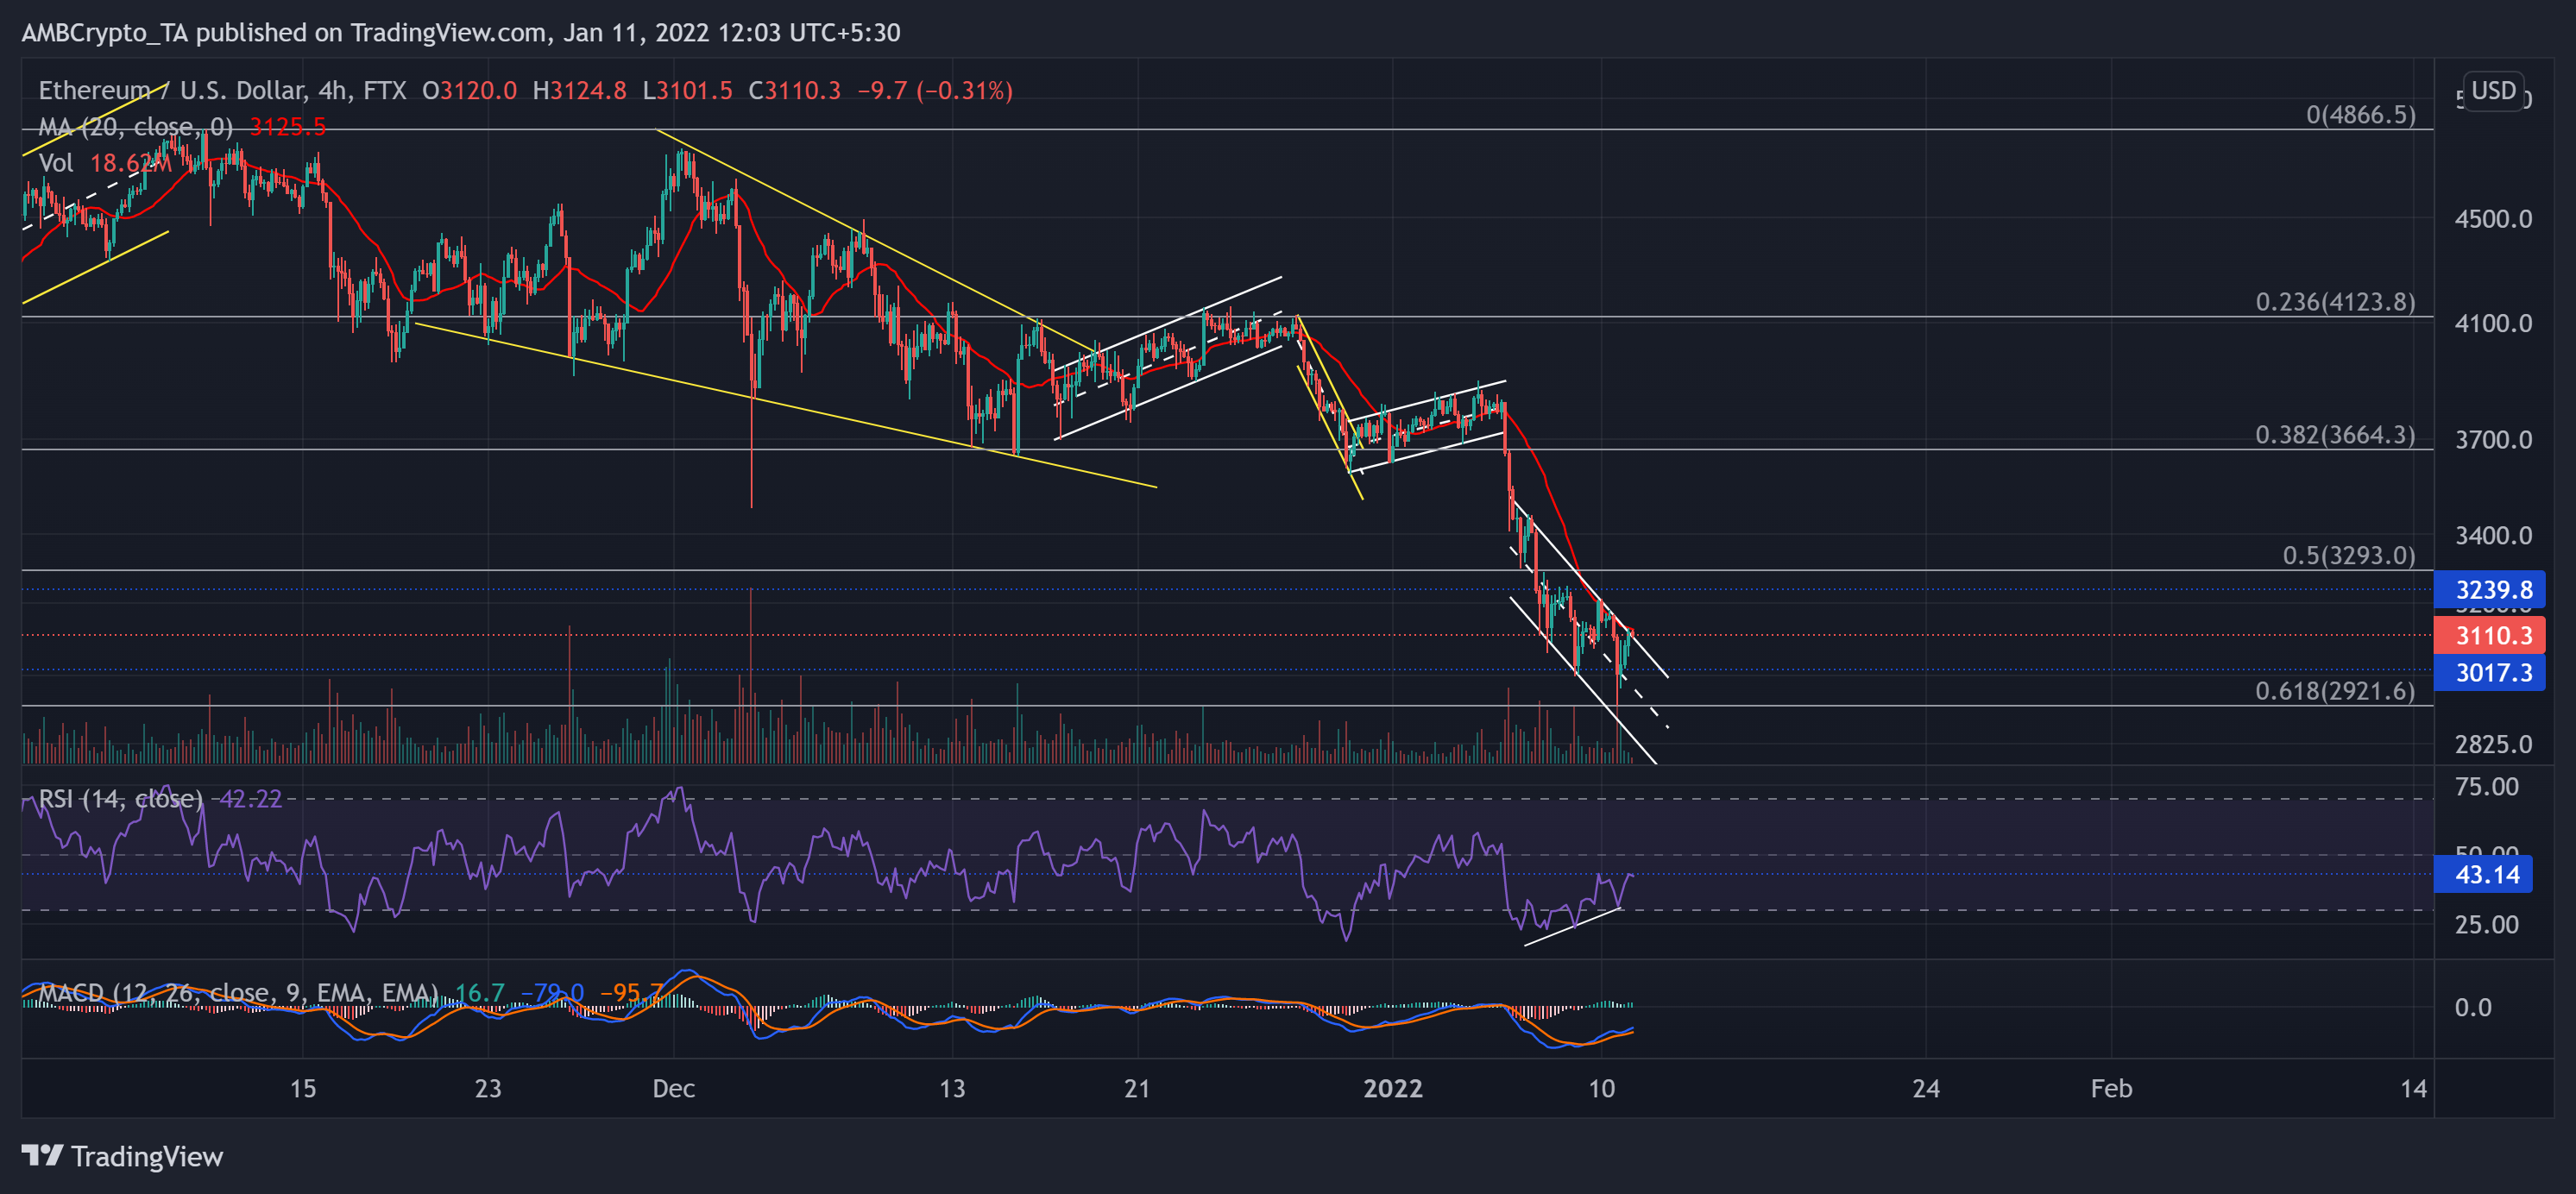
The market-wide pullback on 05 January led ETH to drop the long term (Since July) 38.2%, 50% Fibonacci support.
Although bulls defended the 38.2% level with conviction, the sell-off instigated a 23.45% retracement (from 05 January) until the king alt poked its 15-week low on 10 January. This dip formed a down-channel (white) but rebounded from the 61.8% level.
From here on, the next hurdle for ETH bulls stood at the upper channel that coincided with the 20-SMA (red). Any further dip would find testing support at the $3,000-level.
At press time, the alt traded 36.3% below its ATH at $3,110.3. The RSI was in an uptrend but failed to cross the 43-mark resistance. While MACD histogram displayed an increased buying power, its lines remained below the zero level. Recently, the selling volumes were much higher than incline volumes. Thus, indicating a powerful bear influence.
Internet Protocol (ICP)
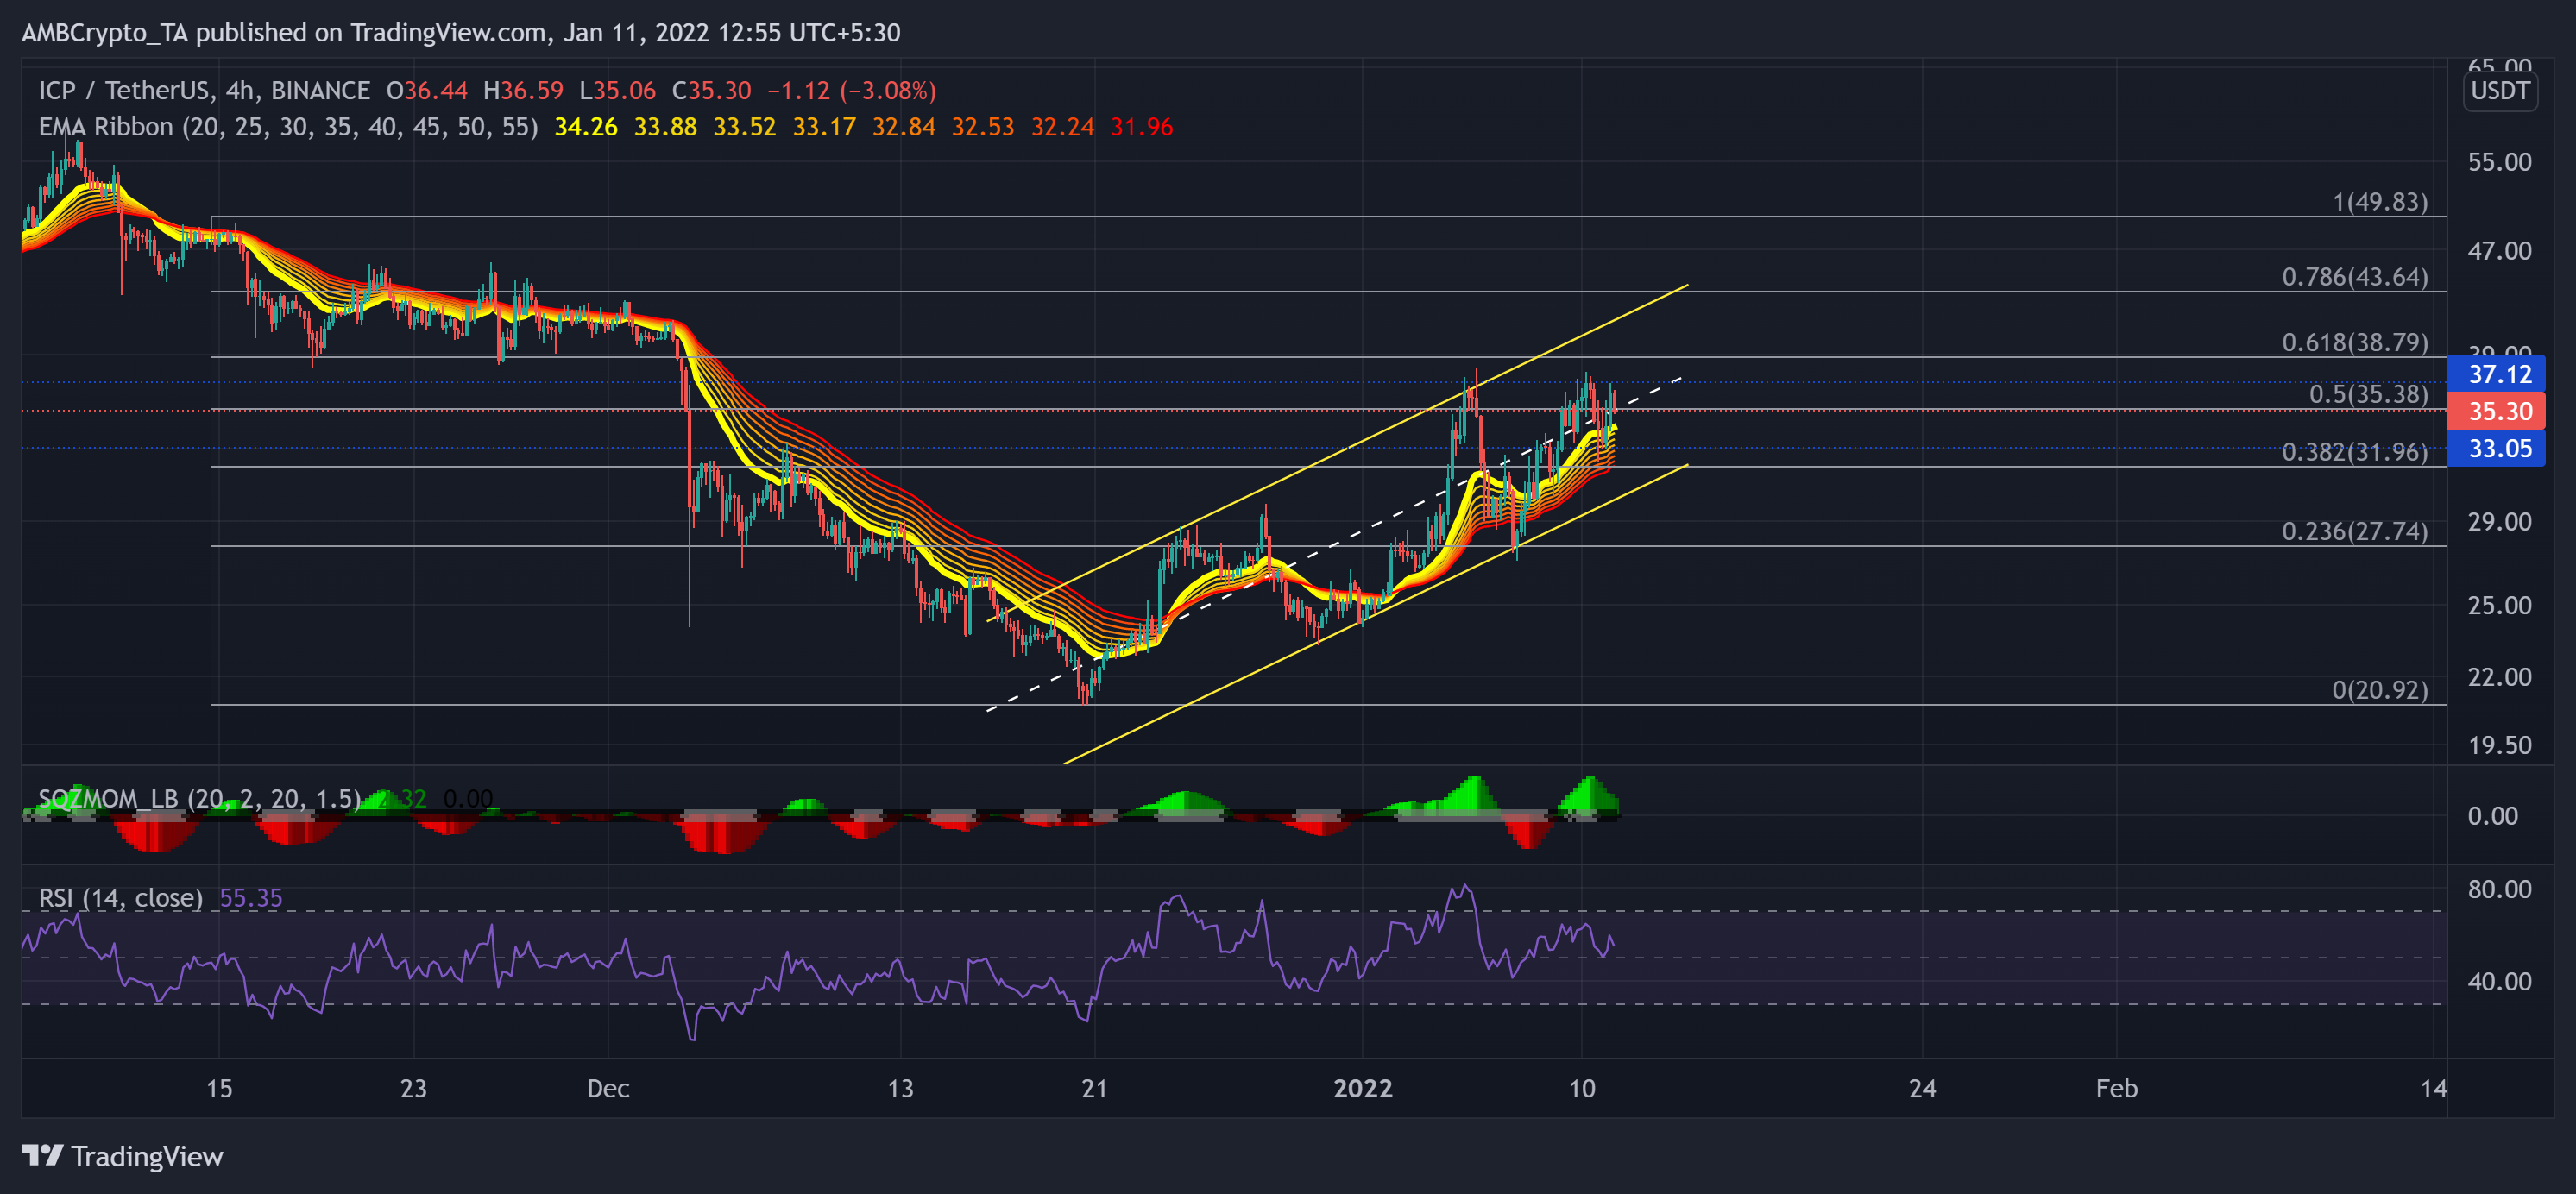
The recent up-channel (yellow) found a convincing close above the 38.2% Fibonacci resistance. The alt saw a nearly 68.15% ROI in the past 21 days after a strong reversal from the $20.9-support.
The EMA ribbons undertook a bullish flip while the 20 EMA stood as strong support over the past three days. Now, as the alt struggled to cross the $38-mark from near the 61.8% level, it saw a pullback.
Also, the Squeeze Momentum Indicator flashed black dots, hinting at a low volatility phase. Any close below all the ribbons would indicate a potential breakdown. At press time, the ICP traded at $35.3 after noting a 1.41% 24-hour gain. The RSI preferred the bulls but pointed south toward the half-line.
Filecoin (FIL)
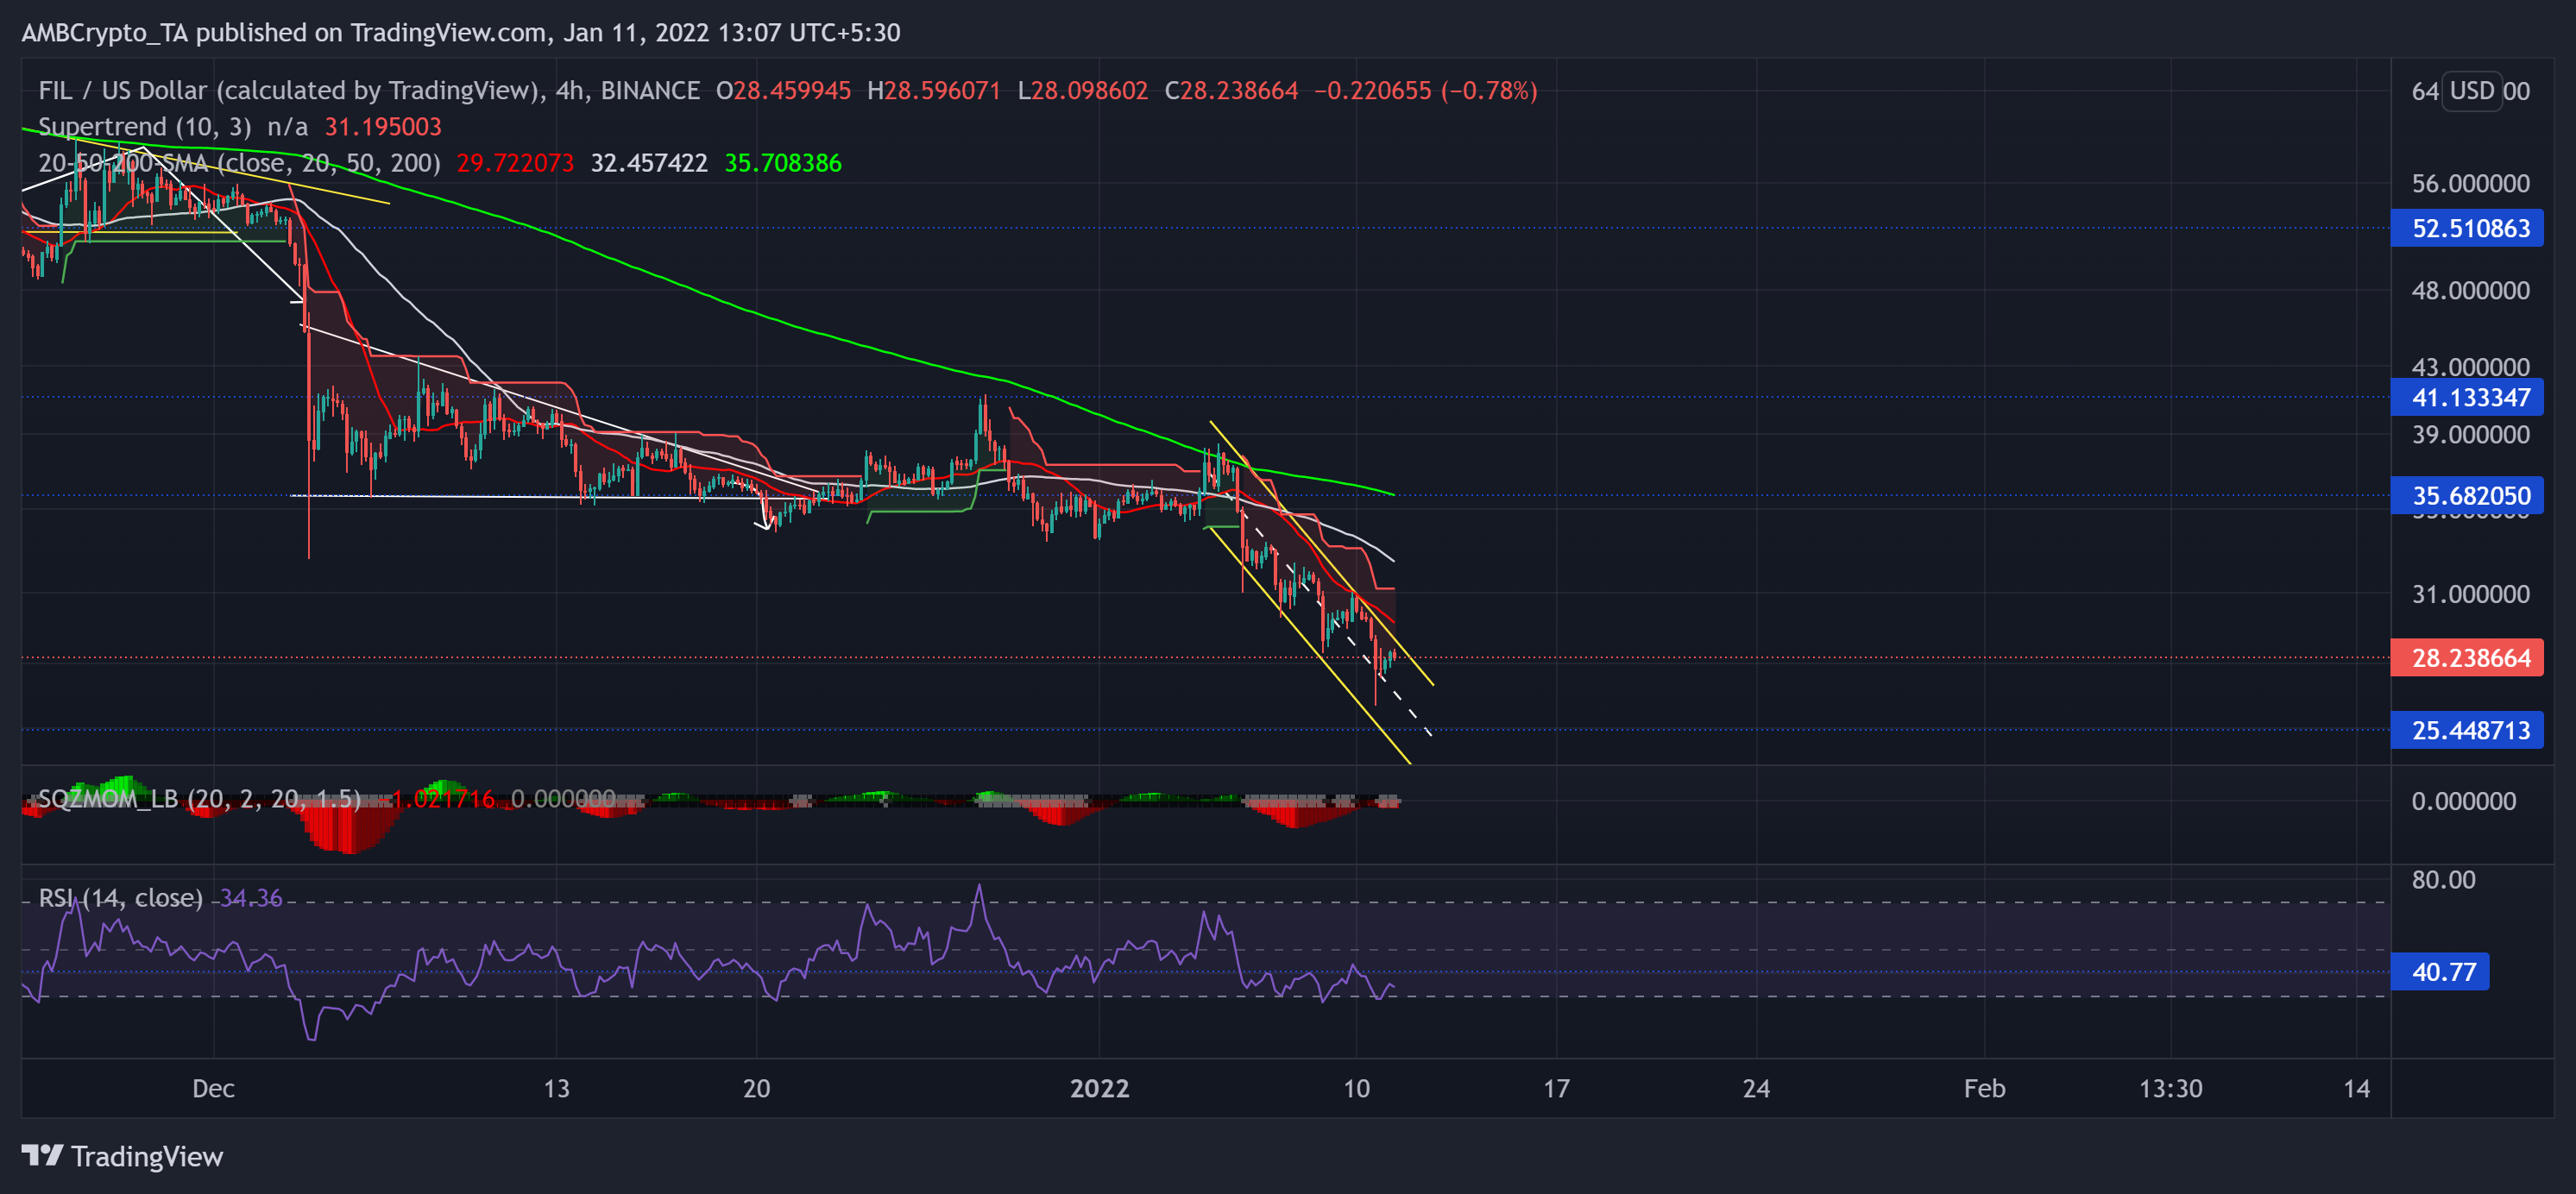
On its 4-hour chart, FIL saw a descending channel (yellow) over the past week. This pattern formed after a 31.97% retracement from the crucial $35-mark resistance (previous support).
The Supertrend visibly chose the long-term bearish tendencies and preferred the sellers. The immediate testing support now stood at the $25.4-level.
At press time, FIL traded below its 20-50-200 SMA at $28.2. The RSI could barely cross the 40-mark while retesting the oversold region thrice in four days. Moreover, the Squeeze Momentum Indicator indicated a high volatility phase by flashing grey dots. Nevertheless, the ADX showed a weak directional trend for FIL.


