Ethereum, IOTA, Compound Price Analysis: 07 September

Ethereum struggled to reclaim the $4000 mark as the coin traded sideways over the past few days. It stood close to its immediate price floor of $3715.04. Altcoins such as IOTA and Compound that have rallied since the beginning of the month, met with a pause as they declined briefly on their respective charts. IOTA fell through the price floor of $1.70 while Compound inched closer to its immediate support of $456.76.
Ethereum (ETH)
ETH/USD, TradingView
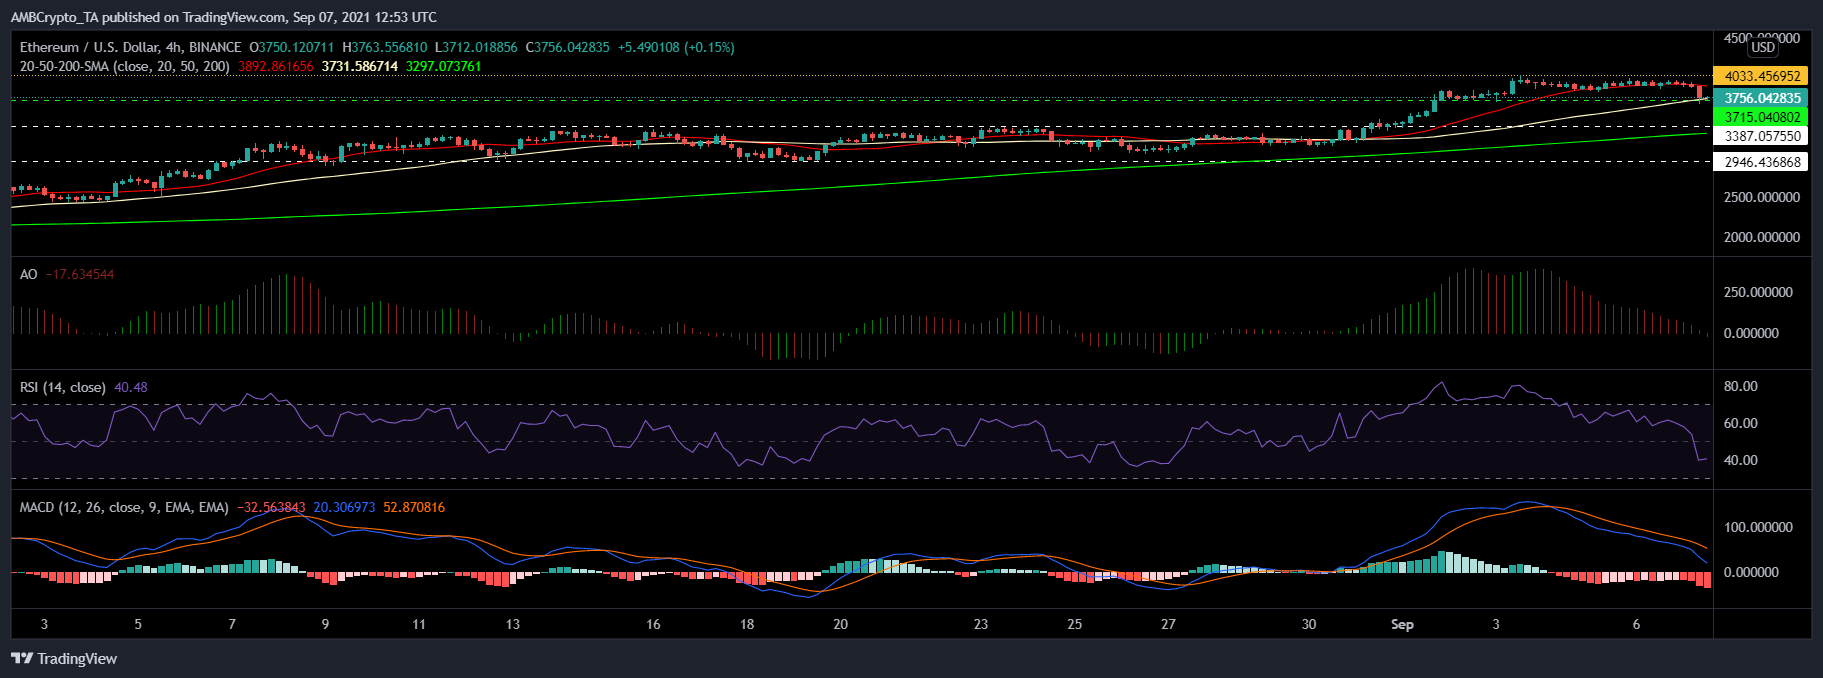
Ethereum’s 4-hour chart displayed a series of small candlesticks which imply consolidation over the last few days. In the last 24 hours, ETH lost 0.5% and was trading at $3756.04.
The altcoin stood near its immediate support line of $3715.04. Additional support level lay at $3387.05 which also marked the weekly low price point for the coin.
Ethereum’s candlestick was seen below the 4-hours 20 SMA which suggested that the price was in the favor of sellers. In correspondence, Awesome Oscillator displayed a buy signal.
Relative Strength Index also stood below the half-line as buying strength had dipped. Growing red bars were visible, on MACD’s histograms. In the event of Ethereum breaking its consolidation on the upside, the overhead resistance stood at $4033.45.
IOTA
IOTA/USD, TradingView
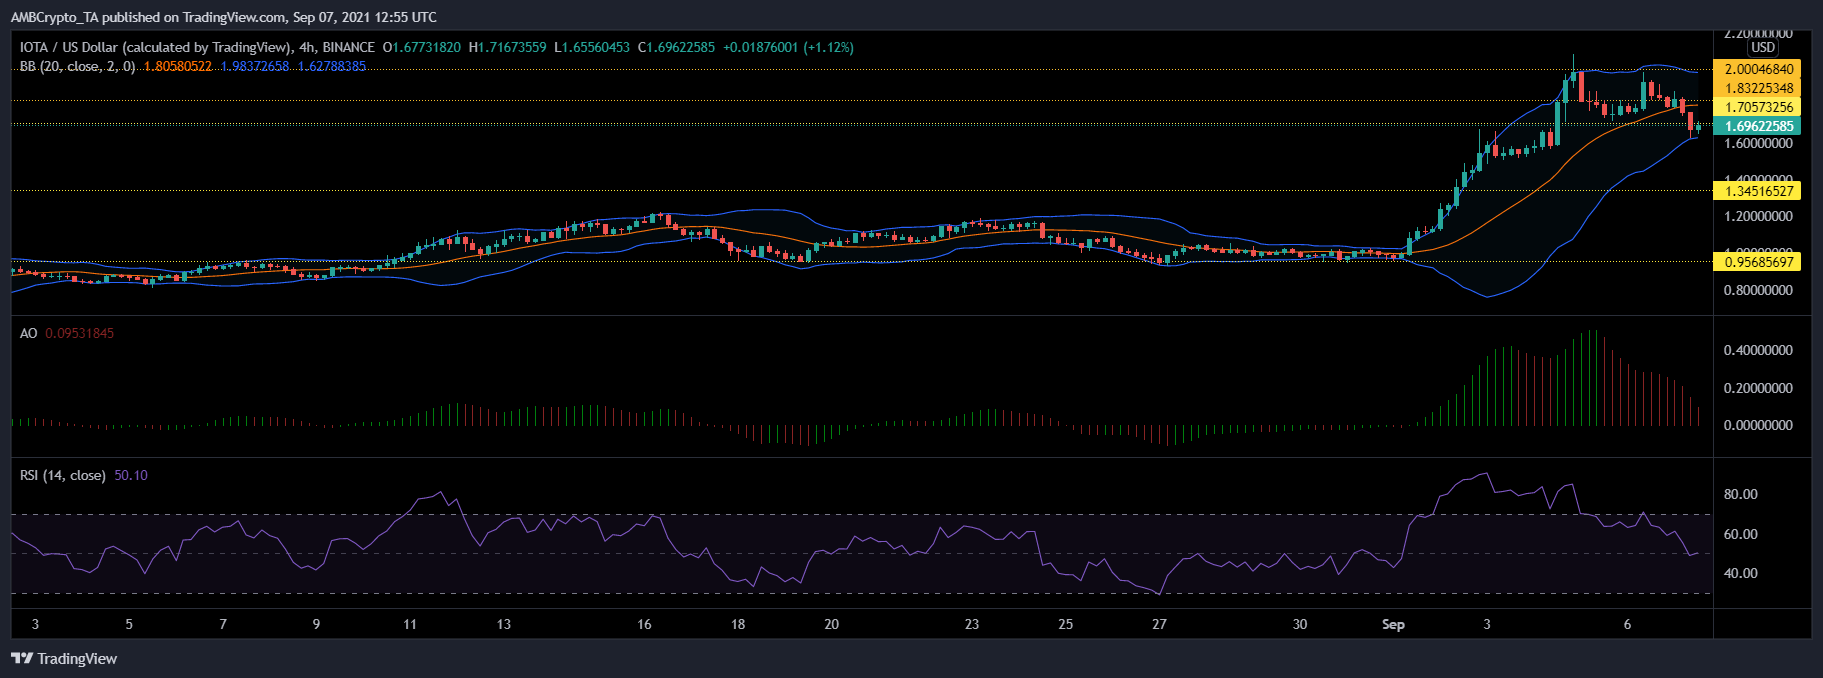
IOTA’s spectacular rally has been paused as the coin showed a southbound movement on its charts. It was trading for $1.69 as it fell through its support line of $1.70. The next big dip could cause IOTA to trade near the $1.34 support line, following which it could revisit its weekly low of $0.95.
Indicators gave off a bearish signal. Awesome Oscillator observed red signal bars. The Relative Strength Index stood right on the half-line after buying pressure revived minorly.
Bollinger Bands have been convergent which meant that market volatility might remain low over the upcoming trading sessions. If buying strength recovers, prices could push to topple over the $1.70 mark and then retest its multi-month high of $2.
Compound
COMP/USD, TradingView
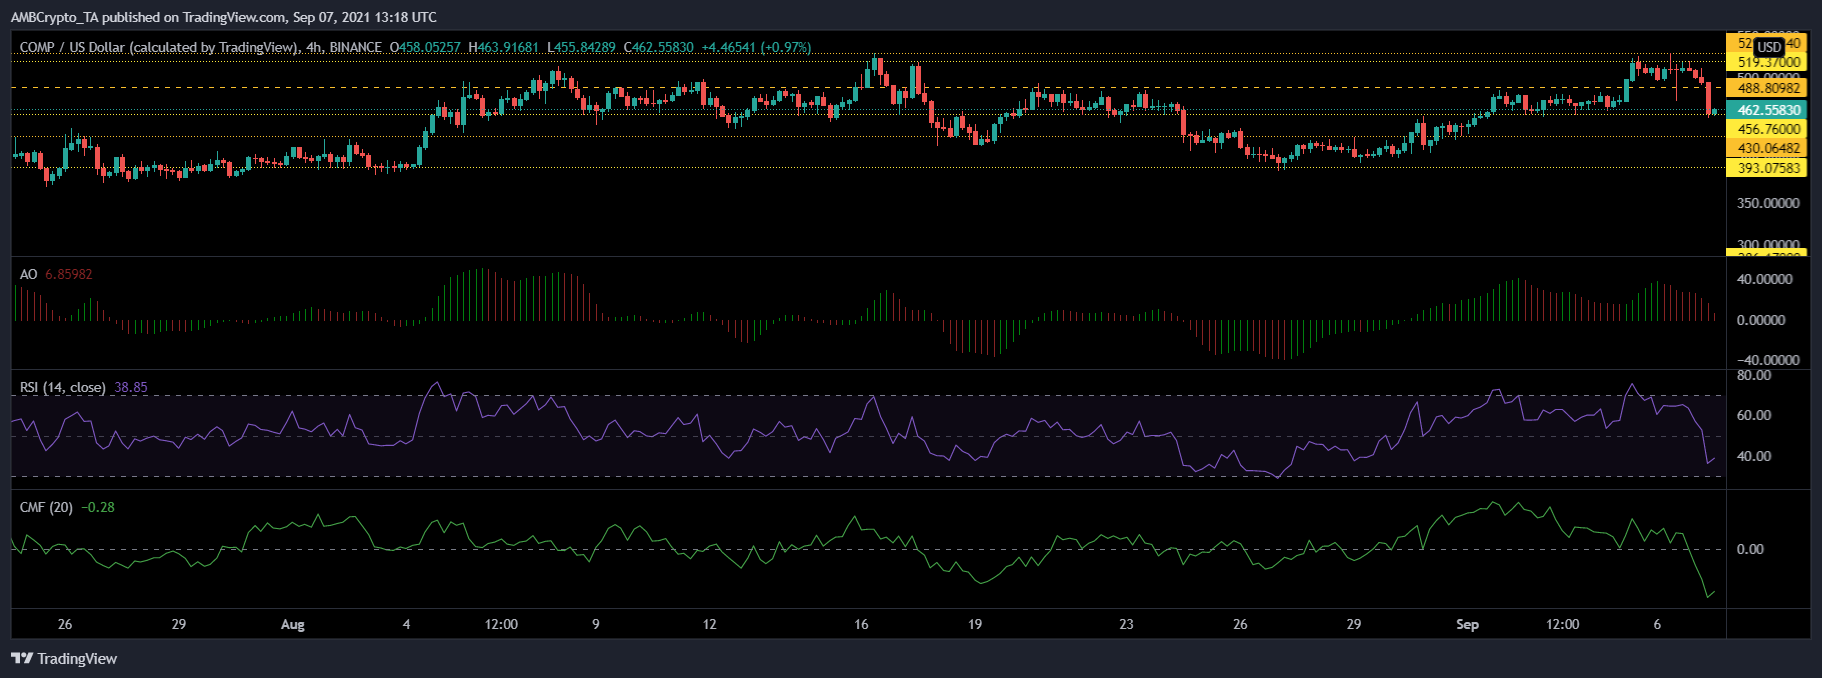
Compound was trading at $462.55 after its uptrend broke, over the last 48 hours. The asset’s technical chart pointed towards negative price momentum.
It was seen nearing its immediate support level of $456.76. A drop below the $456.76 would mean COMP would trade near its weekly low prices of $430.06. Awesome Oscillator flashed red signal bars. Relative Strength Index was parked beneath its half-line as buying pressure declined.
Chaikin Money Flow also remained below its mid-line as a result of capital inflows decreasing. Recovery of buying strength could flip prices to topple over the $488.80 price ceiling. Successfully trading above the $488.80 mark would push prices to reclaim the multi-month high of $519.37.


