
Ethereum recaptured a key resistance mark at $1,687, a level that had not been breached since the broader market pullback in late-February. Monero lacked the trading volumes and buying intensity to flip the 38.2% Fibonacci retracement level. Lastly, FTX Token eyed a rise above its overhead resistance but the indicators presented the chances of a short-term reversal.
Ethereum [ETH]
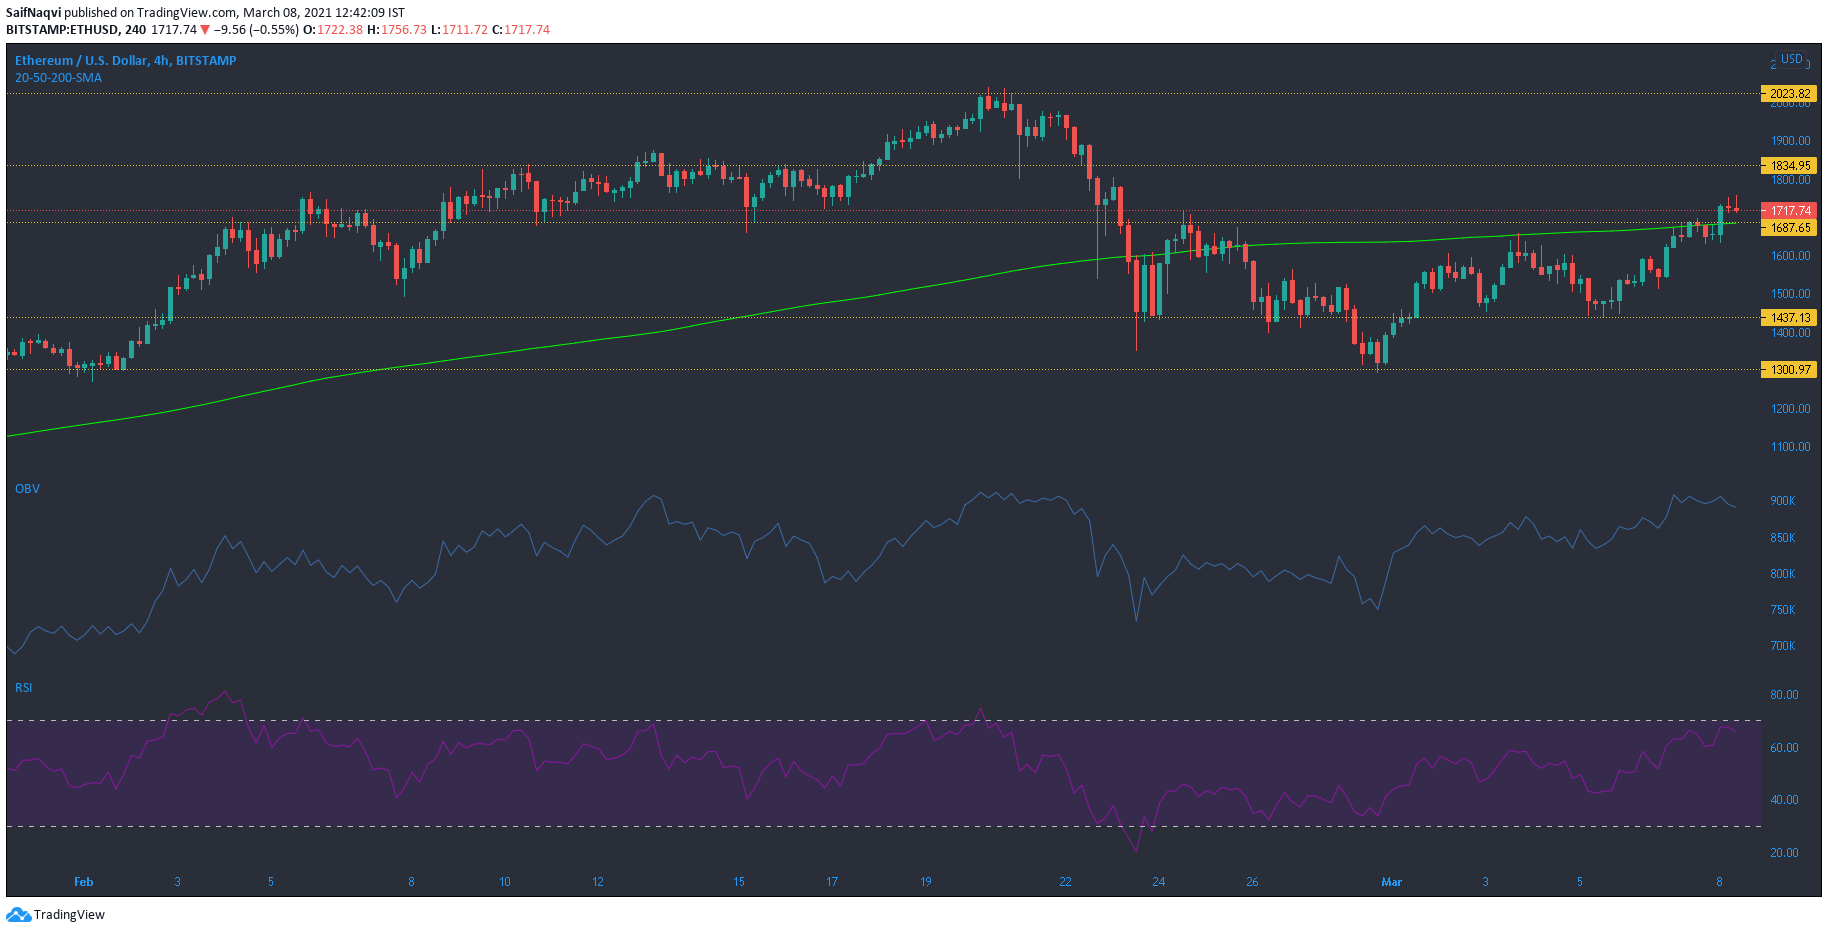
Source: ETH/USD, TradingView
Ethereum retook the $1,680 level from the bears thanks to a surge of 6% in the last 24 hours. Gains in the last eight days amounted to over 30% and underscored ETH’s bounce back from the $1,300 level. The On Balance Volume showed strong buying at two key support levels – one at the $1,300 mark and the other at $1,437 as the price headed northbound on the charts. However, the OBV made steady highs over the past few sessions and even dipped at the time of writing.
The RSI pointed lower from just below the overbought zone and showed weakening bullish strength in the market. This reinforced the idea that a hike in trading volumes could be needed before steering clear of the next test at $1,834.9 and especially if the uptrend were to sustain itself. In the event of a pullback, the newly flipped resistance at $1,687.65 could act as a crucial line of support.
Monero [XMR]
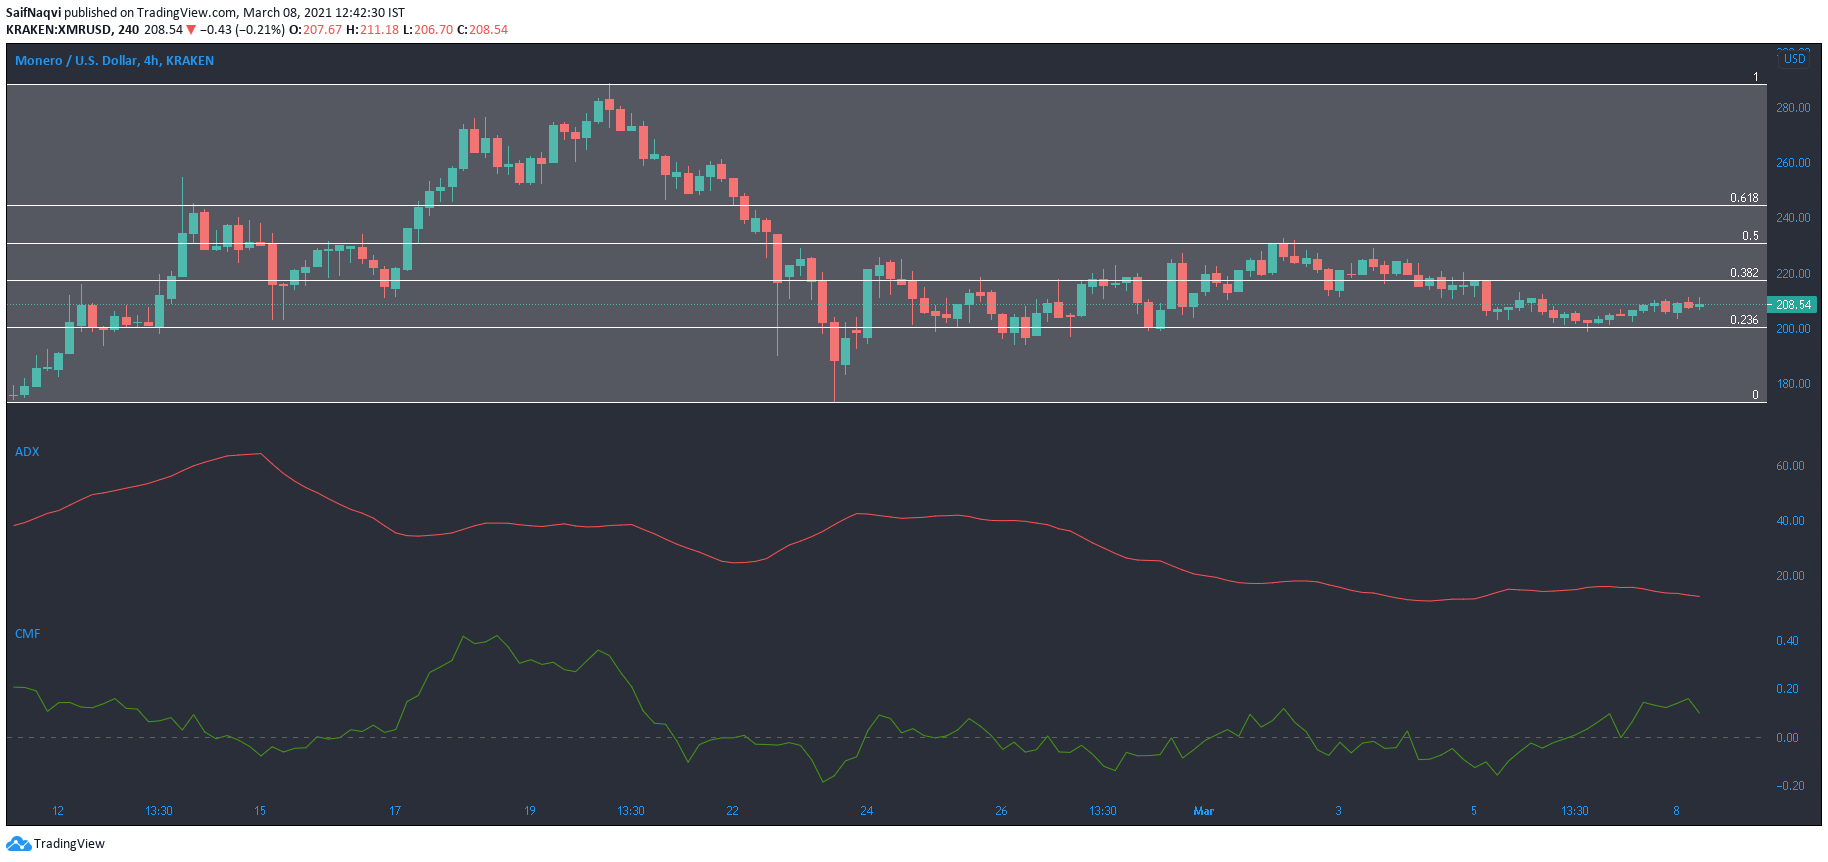
Source: XMR/USD, TradingView
Low trading volumes and short-bodied candlesticks on Monero’s 4-hour chart showed a dearth of interest in the market but the bulls still held on to the 23.6% Fibonacci retracement level. A breakout above the 38.2% level could depend on stronger cues from the broader market, which would spur buying in the Monero market as well.
The ADX pointed lower and towards the 10-mark, showing a lack of a strong trend. The flow of capital towards the cryptocurrency created some optimism, but the price remained within its channel even as the CMF rose sharply above the half-way mark. The index reversed direction and pointed towards the half-line at the time of writing.
FTX Token [FTT]
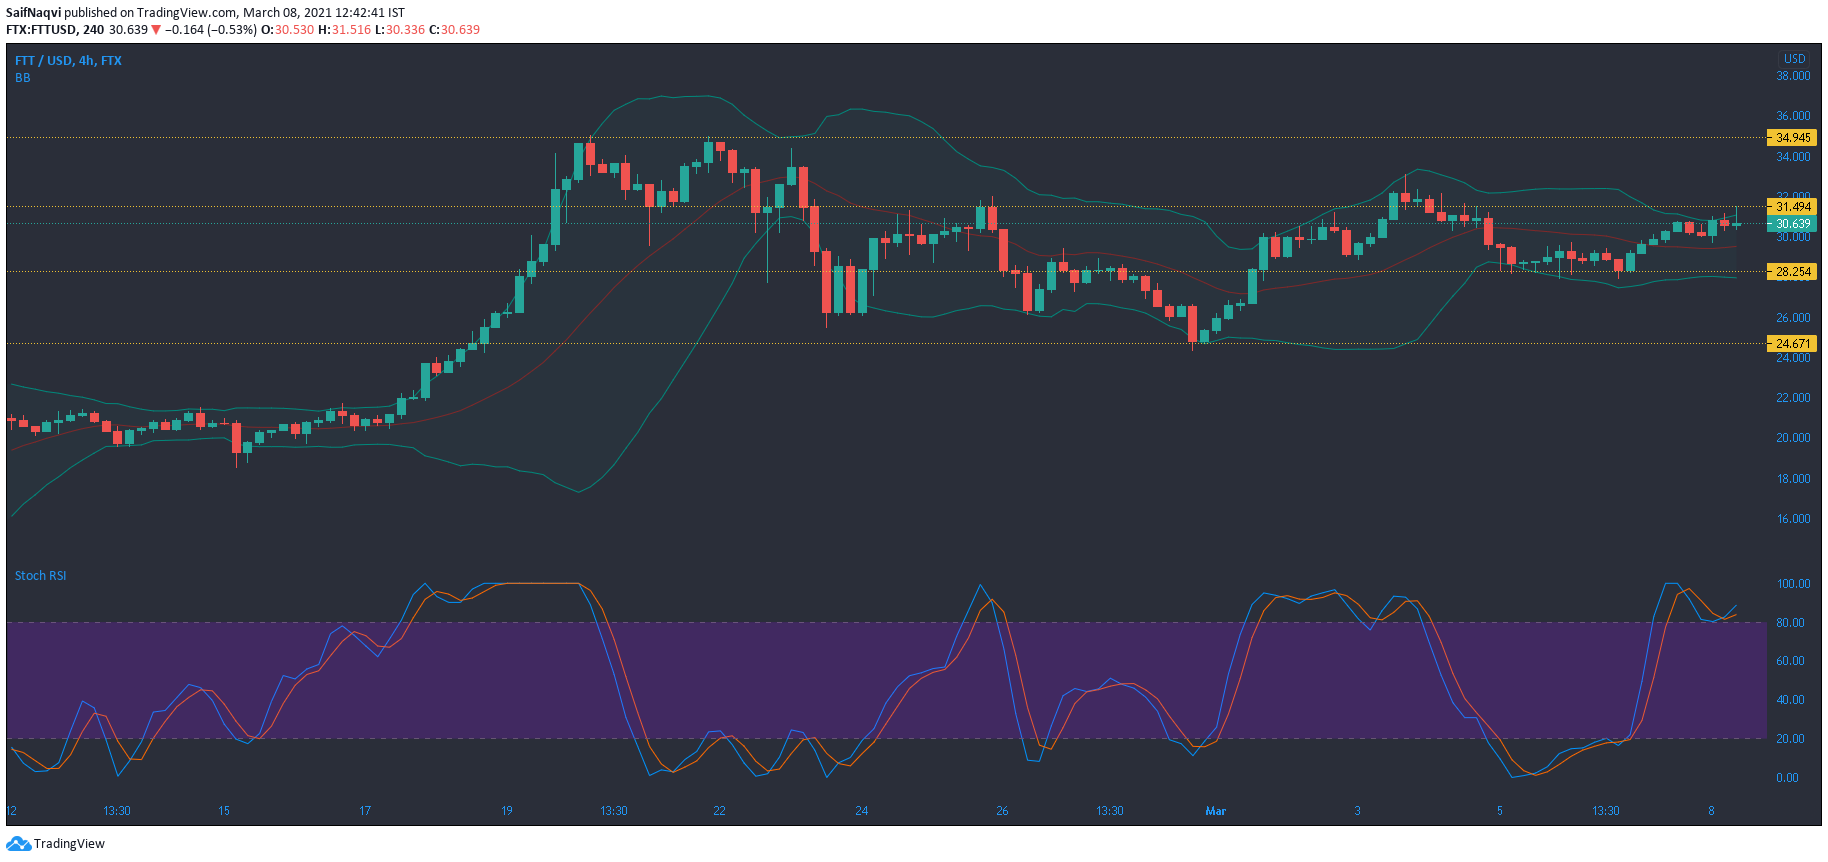
Source: FTT/USD, TradingView
The Bollinger Bands on FTX Token expanded at press time and showed rising volatility as the price looked to flip $31.49 resistance. The presence of volatility allowed for large price swings and a break above the upper ceiling looked imminent over the coming sessions. Even though the Stochastic RSI traded in the overbought region, it pointed upwards after retesting the upper line and indicated a delayed stay in its current region.
However, there was also a possibility of a short-term pullback due to saturation in the market. A fall below the press time support level would highlight the next line of defense at $24.67.