Ethereum: These will be the signs of ETH rallying to a new ATH

Ethereum has been following Bitcoin‘s price track for a while. Now, even though it’s not a bad trajectory per se, it’s not all that great either. With Bitcoin testing the crucial $42k mark at press time, it’s time for the market’s top altcoin to register some massive gains too.
What does the price say?
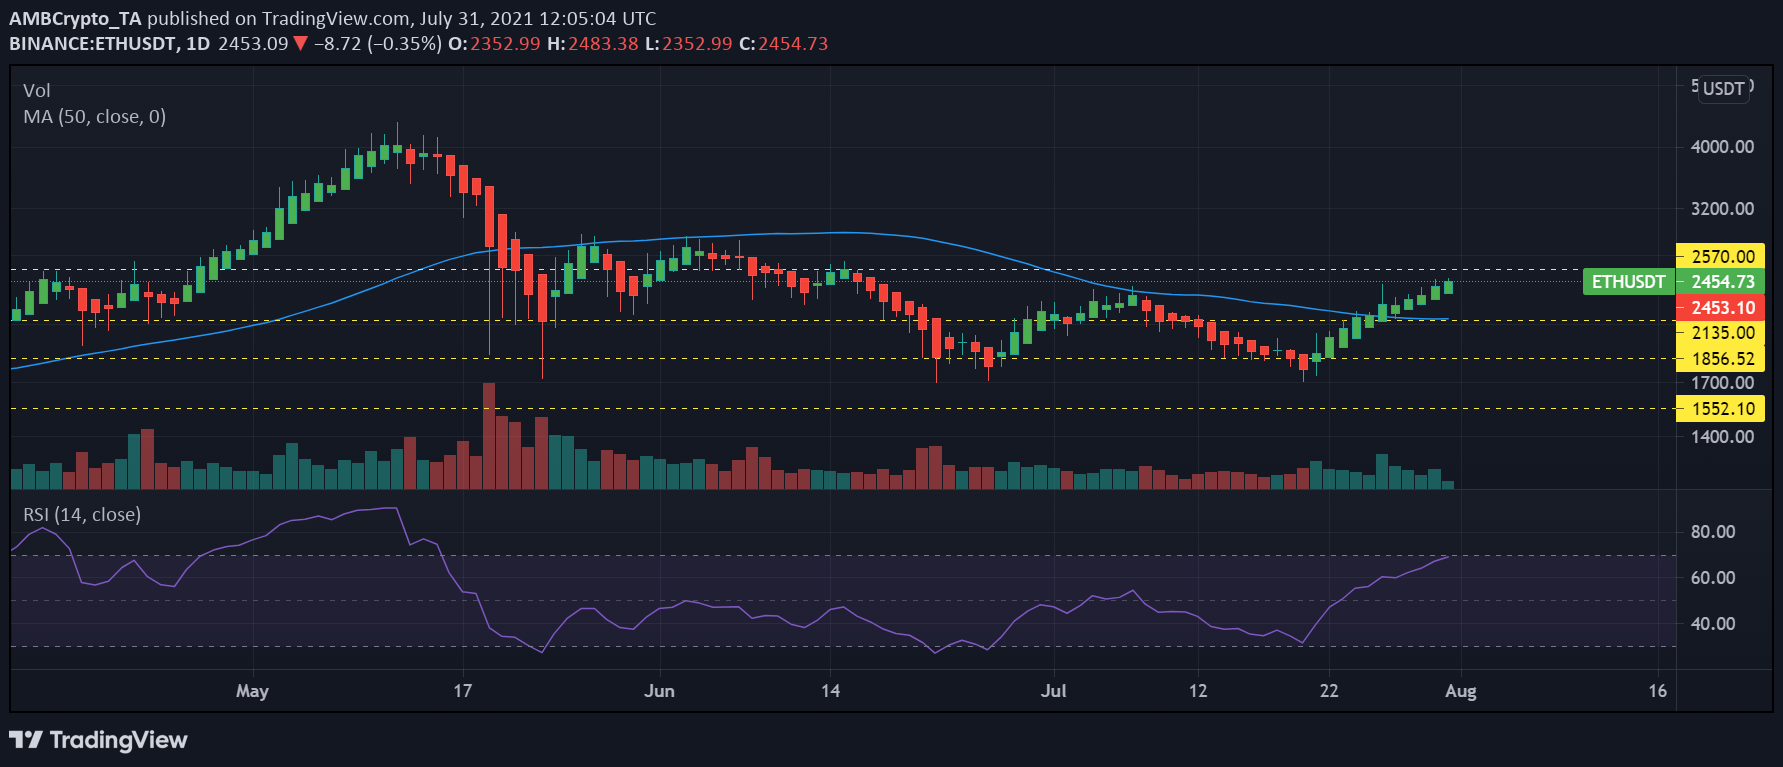
Over the last 11 days, Ethereum recorded almost 40% gains, a figure that is a little better than BTC’s. Now, even though ETH is soaring on the chats with its last 11 candlesticks closing in the green, it needs to test the $2570 resistance to show some real strength.
It is also notable that ETH closed above its 1D MA50 (blue trend-line) for the first time since the May correction. Since the March 2020 COVID collapse, that has been an early indicator of an upcoming rally. Noticeably, all through the May rally, the MA50 acted as a support for the price with the Relative Strength Index flashing overbought for ETH – A major indicator.
On the downside, however, trader and analyst Scott Melker recently pointed out that there seemed to be a bearish divergence of the RSI on the 4-hour chart. And yet, ETH’s price has continued to hike.
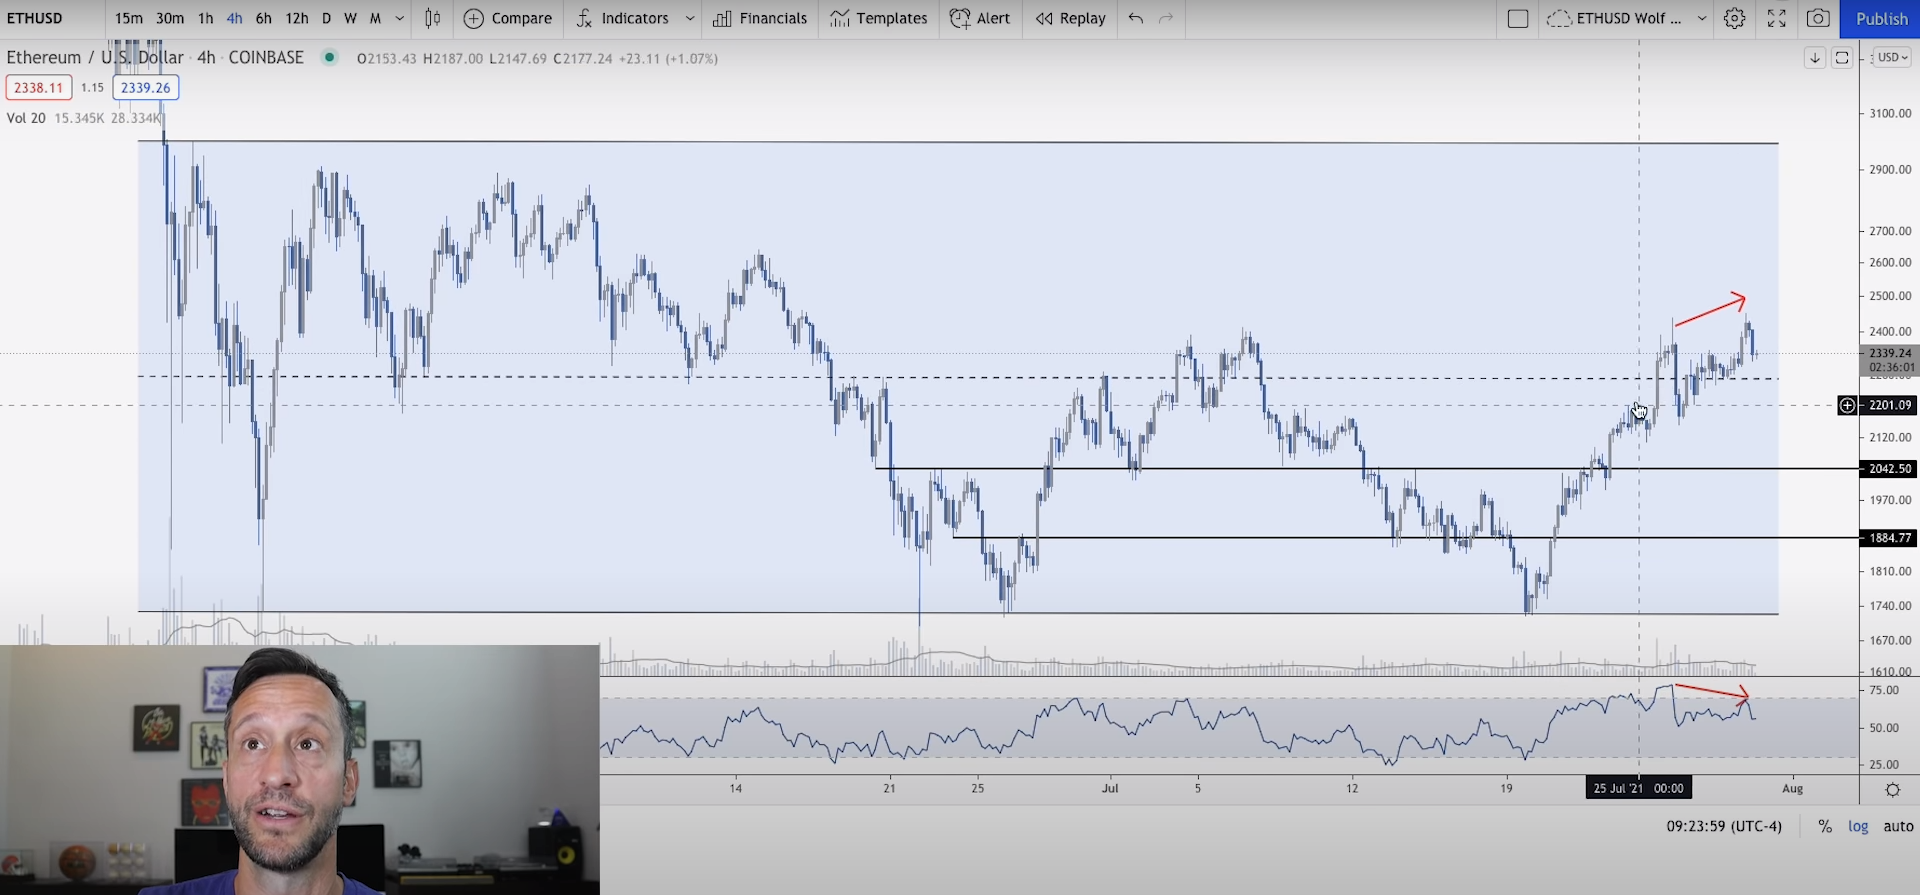
On the ETH/BTC chart, Melker noted that as Bitcoin retraced, a little bounce was seen. According to the analyst, what this meant was that if it continues to consolidate here, an actual hike in the value of altcoins would be seen.
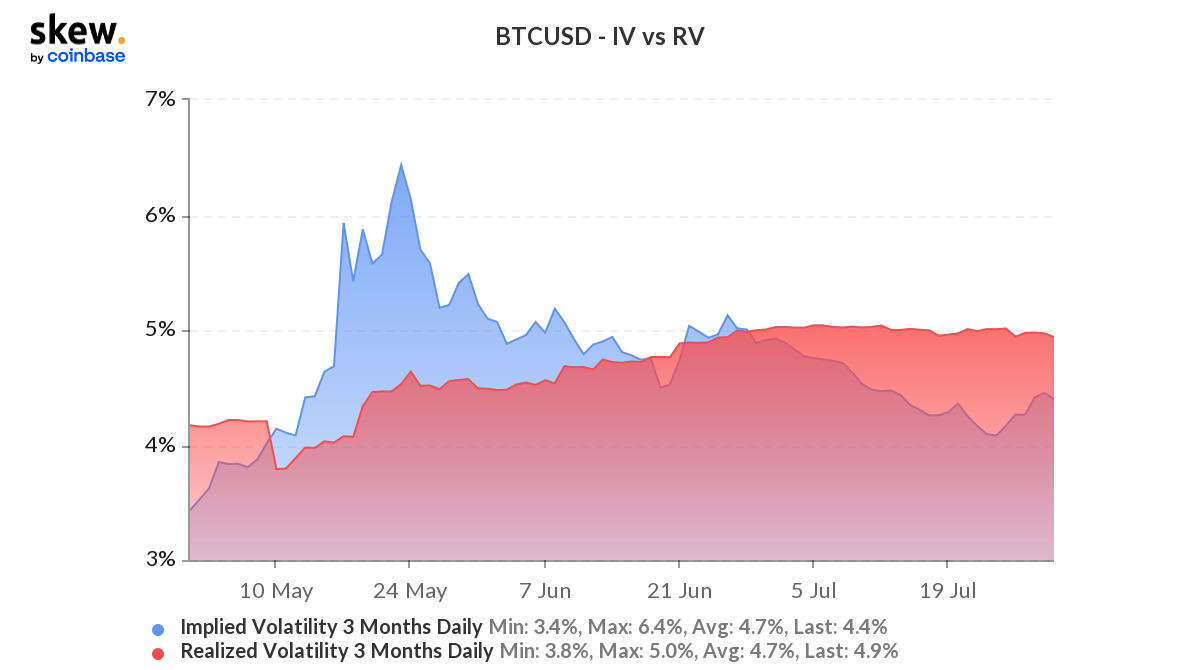
Further, a look at Ethereum’s Realized volatility v. Implied volatility suggested that there were no significant moves. It formed a parabolic curve presenting the hike in price on 29 July. However, it came down the very next day.
Another northbound move by the Implied volatility might be a good rally signal and will be worth noting.
Will there be another ATH by the end of the year?
A recent post on TradingView highlighted the Fibonacci Channel on Ethereum’s price action since March 2020. Here, the RSI acted as a rough indicator of a price breakout.
It revealed that the price tends to break above the 1D MA50 as it has an approximate 60.00 break-out level. Once that level breaks, it has taken ETH either 132, 137, or 70 days to reach its next top on the Fibonacci scale (which is above $14,000).
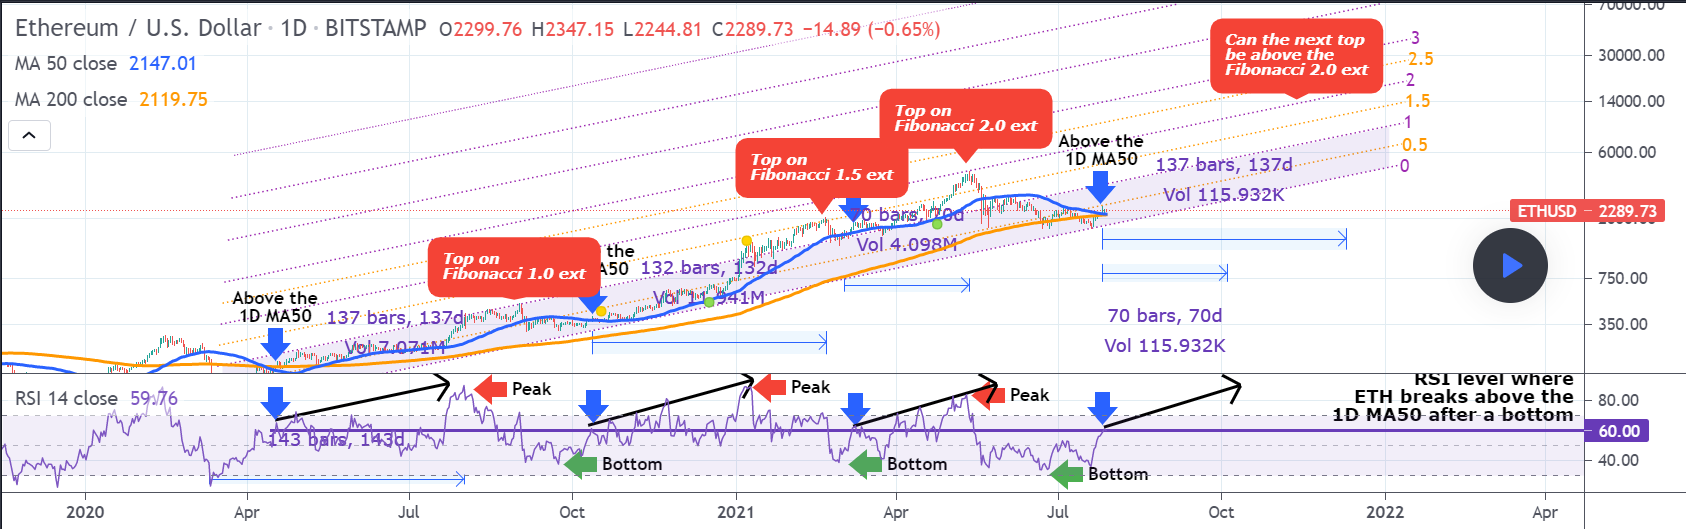
It can also be observed that the tops are progressive, one level higher each time. First 1.0, then 1.5, and the most recent one in May at 2.0 Fib.
According to the same, it can be assumed that the next top will be at 2.5 or higher.
It’s worth noting, however,
“… certainly appears to be a very high level for ETH’s press time price, especially if it technically “needs” to be achieved in 137 days.”
Even so, it’s not impossible, especially when the price breakout above the 50-day SMA and the hike in RSI are looked at.