Fantom, Dogecoin, Bitcoin Cash Price Analysis: 05 January

While the overall sentiment still lingered around the uncertain or the fear zone, Dogecoin and Bitcoin Cash refrained from committing to a trend and were rangebound. Dogecoin saw a recent spike in buying pressure, but the 50 SMA hurdle stood strong.
On the contrary, Fantom swiftly upturned after registering a 35.4% ROI in the past week and poked its two-month-high on 04 January. Now, as it eyed to retest its ATH, its technicals flashed overbought readings.
Fantom (FTM)
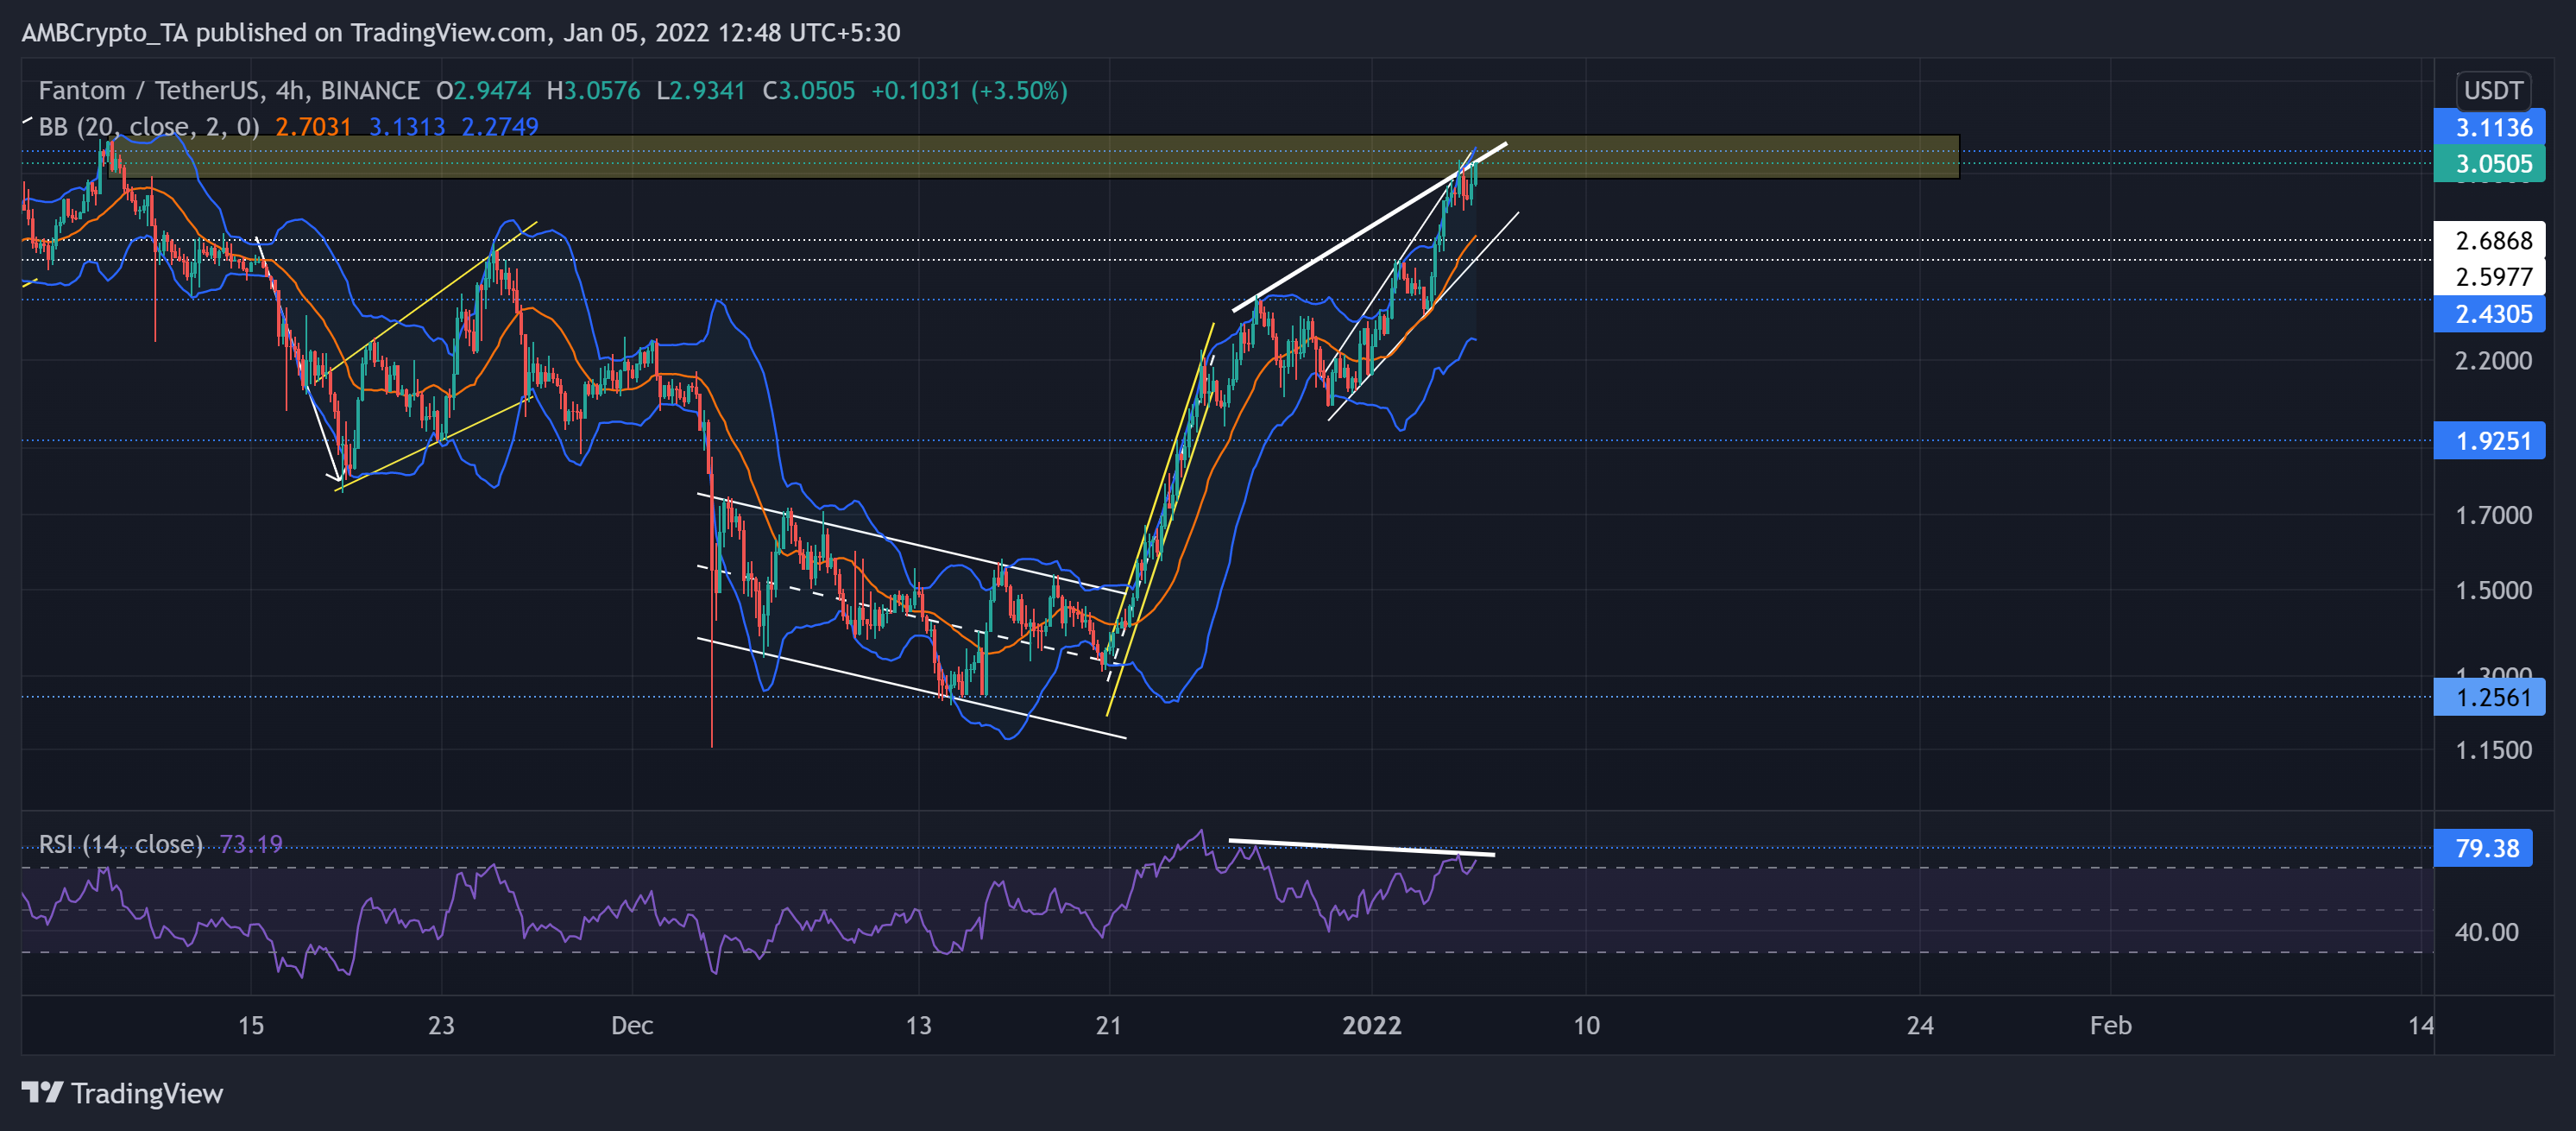
FTM invalidated the market-wide bearish tendencies as it approached its long-term supply zone (rectangle, yellow). The alt saw a staggering 132.23% ROI (from 20 December low) in just 15 days. With this upturn, it recovered all the losses from its previous downtrend.
The altcoin formed an ascending broadening wedge (reversal pattern, white) on its 4-hour chart. The immediate resistance stood at the $3.11-mark. Now, a bearish divergence (white) between the RSI and price action hinted at a possible near-term reversal.
At press time, FTM traded at $3.0505. The RSI was deep into the overbought region and confirmed the one-sided bullish force. Also, the price swayed near the upper band of the Bollinger Bands (BB). Keeping in mind the overbought readings on the RSI and BB, a pullback from here should not surprise the investors/traders.
Dogecoin (DOGE)

As we saw in the previous article, DOGE continued with its range-bound oscillation after a falling wedge (green) breakout. The alt formed a side-channel (white) on its 4-hour chart.
The meme-coin ensured the $0.1739 and $0.1675-mark for over eight days now. As a result, the Squeeze Momentum still flashed black dots, indicating low volatility. The past two green candles saw a considerable rise in volumes, hinting at a strong bull move. Thus, the OBV saw a sharp spike too. Now, the 50-SMA (red) stood as a hurdle for the bulls to conquer.
At press time, DOGE traded at $0.1699. The RSI plunged below the equilibrium and wavered near the 44-point level. Besides, the ADX still displayed a weak directional trend for the alt.
Bitcoin Cash (BCH)

The bearish flag (yellow) breakdown pushed DOT’s price below the 38.2% resistance. The bulls ensured the 419-support while bears retested it multiple times over the past year.
Thus, the alt consolidated between the above two levels for over three weeks now. At press time, the alt traded below its 20-50-200 SMA at $430.4.
The RSI stood at the 42-mark after bouncing from the 38 point support. A sustained close above half-line could reignite the chances of a bullish revival. While the DMI lines were on the verge of a bullish crossover, the ADX displayed a weak directional trend for the alt.


