Gauging the efficacy of long bets for Stellar [XLM] right now

Disclaimer: The findings of the following analysis are the sole opinions of the writer and should not be considered investment advice
Over the past month, the constant bullish build-up around the $0.11-$0.12 range has enabled a volatile break, one that aided Stellar [XLM] in testing the $0.13-ceiling. This buying resurgence entailed a rising wedge structure as the oscillation kept shrinking between the converging lines.
A potential reversal from the immediate ceiling could foster a bearish break below the pattern.
At the time of writing, XLM was trading at $0.1285, up by 1.5% in the last 24 hours.
XLM Daily Chart
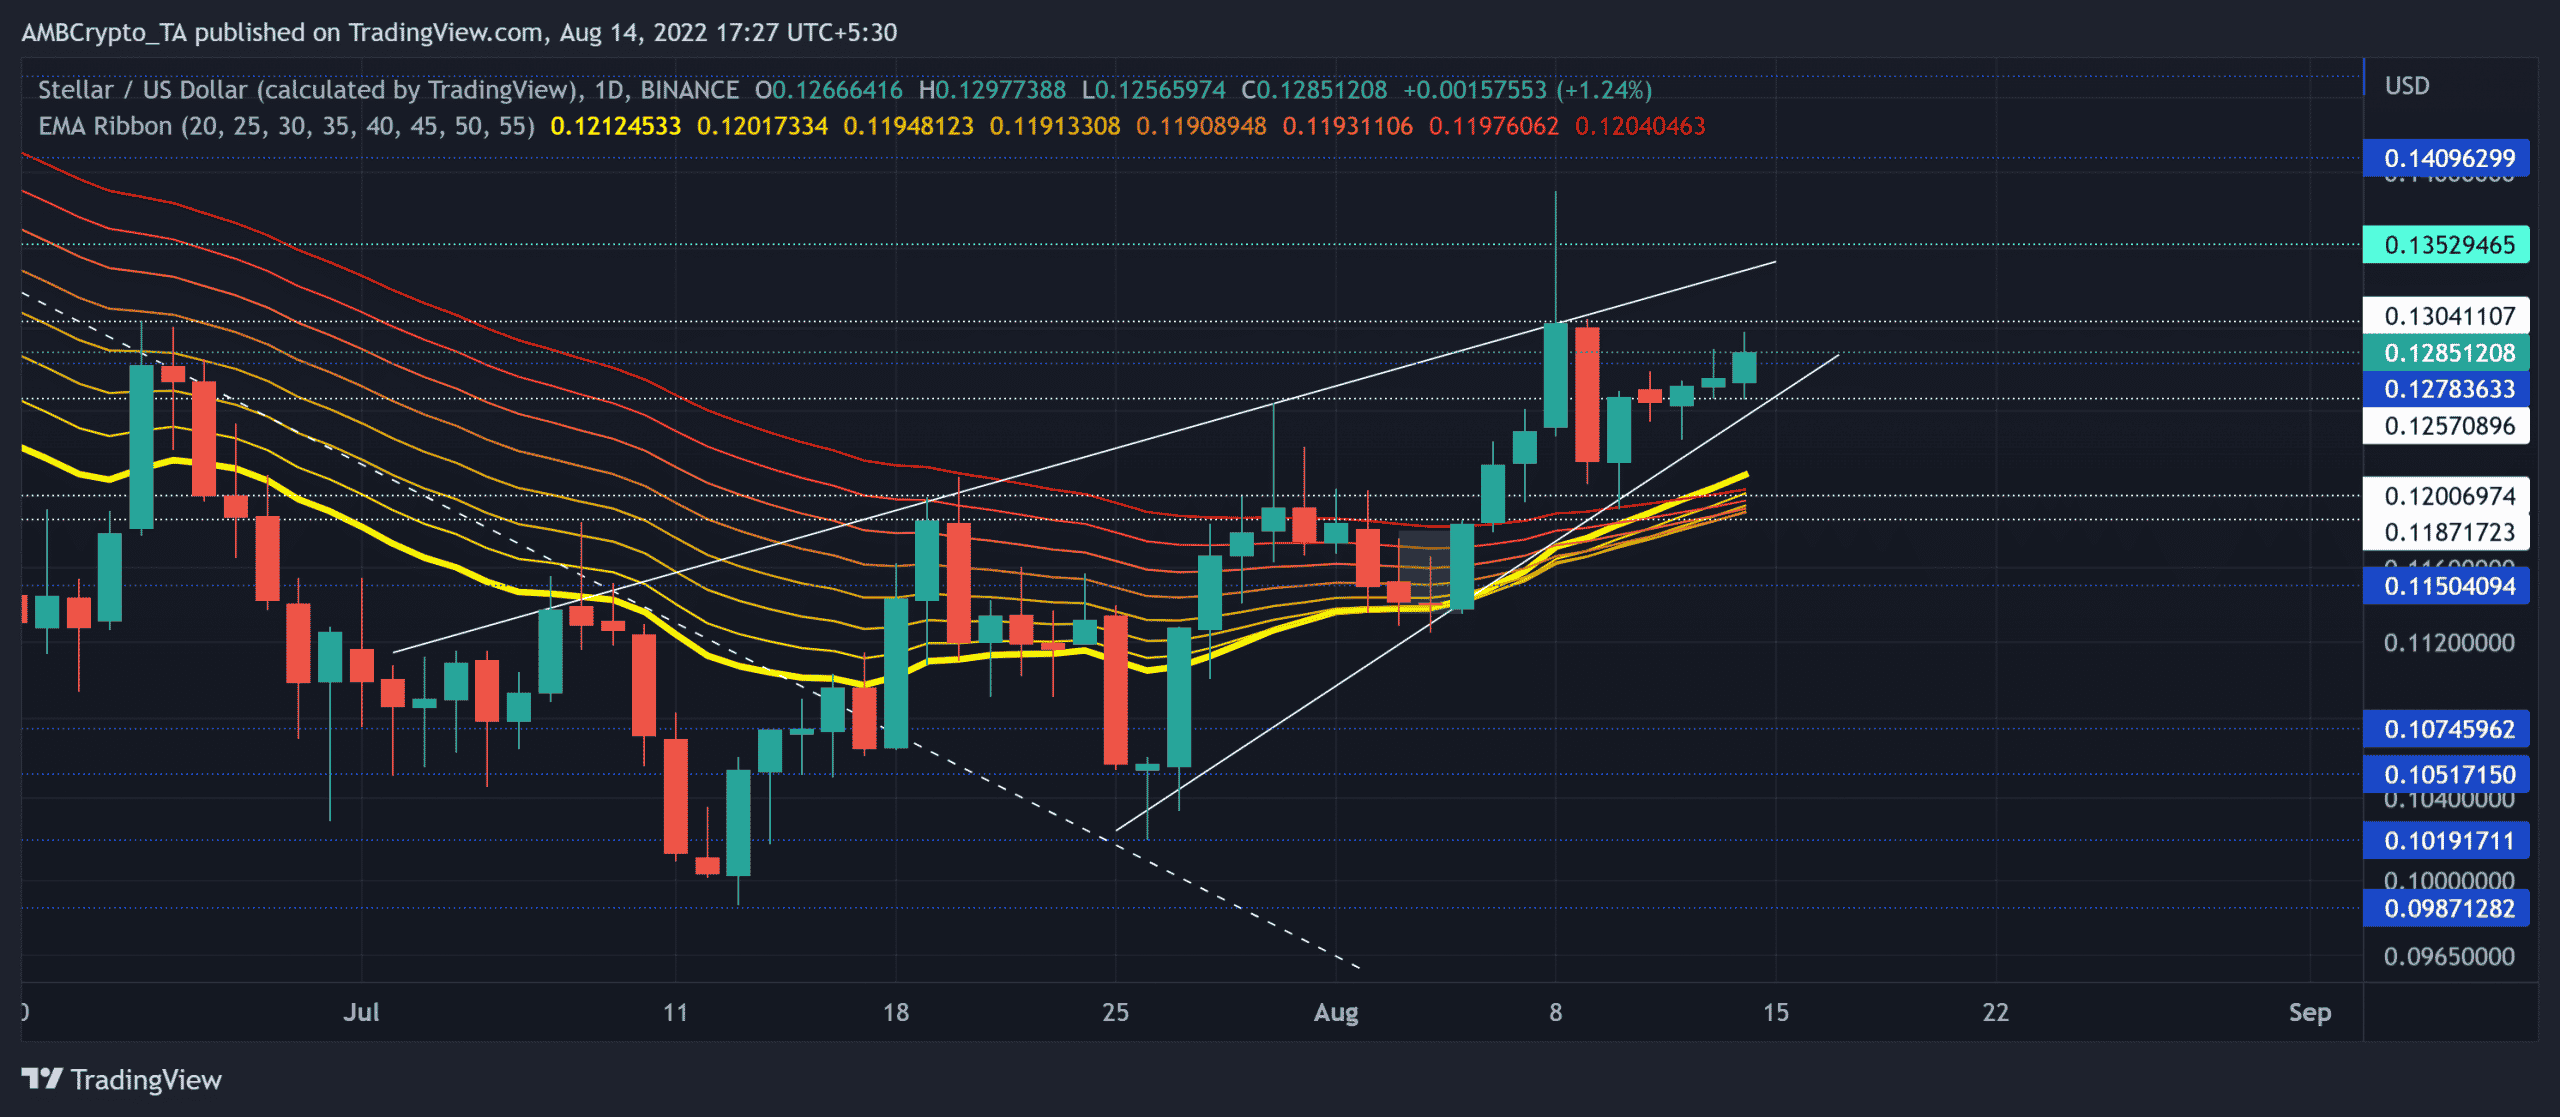
XLM’s previous downtrend evoked the four-month trendline support (previous resistance) on the daily chart. After dropping down towards its 20-month low on 13 July, buyers doubled down on their momentum after breaching the trendline support.
As a result, the price action jumped above the EMA ribbons. The eventual bullish flip on the ribbons reflected the heightened bullish edge. Sustained northbound movement of the 20 EMA could extend the near-term bullish advantage.
Should the $0.13-resistance reignite the selling power, the alt could see a sluggish phase. A close below its press time pattern could indicate a short-term slowdown. In this case, XLM would retest the $0.12-$0.118 range before picking itself up again. The bulls must hold up the support near the EMA ribbons to ensure the alt’s gradual growth.
Rationale
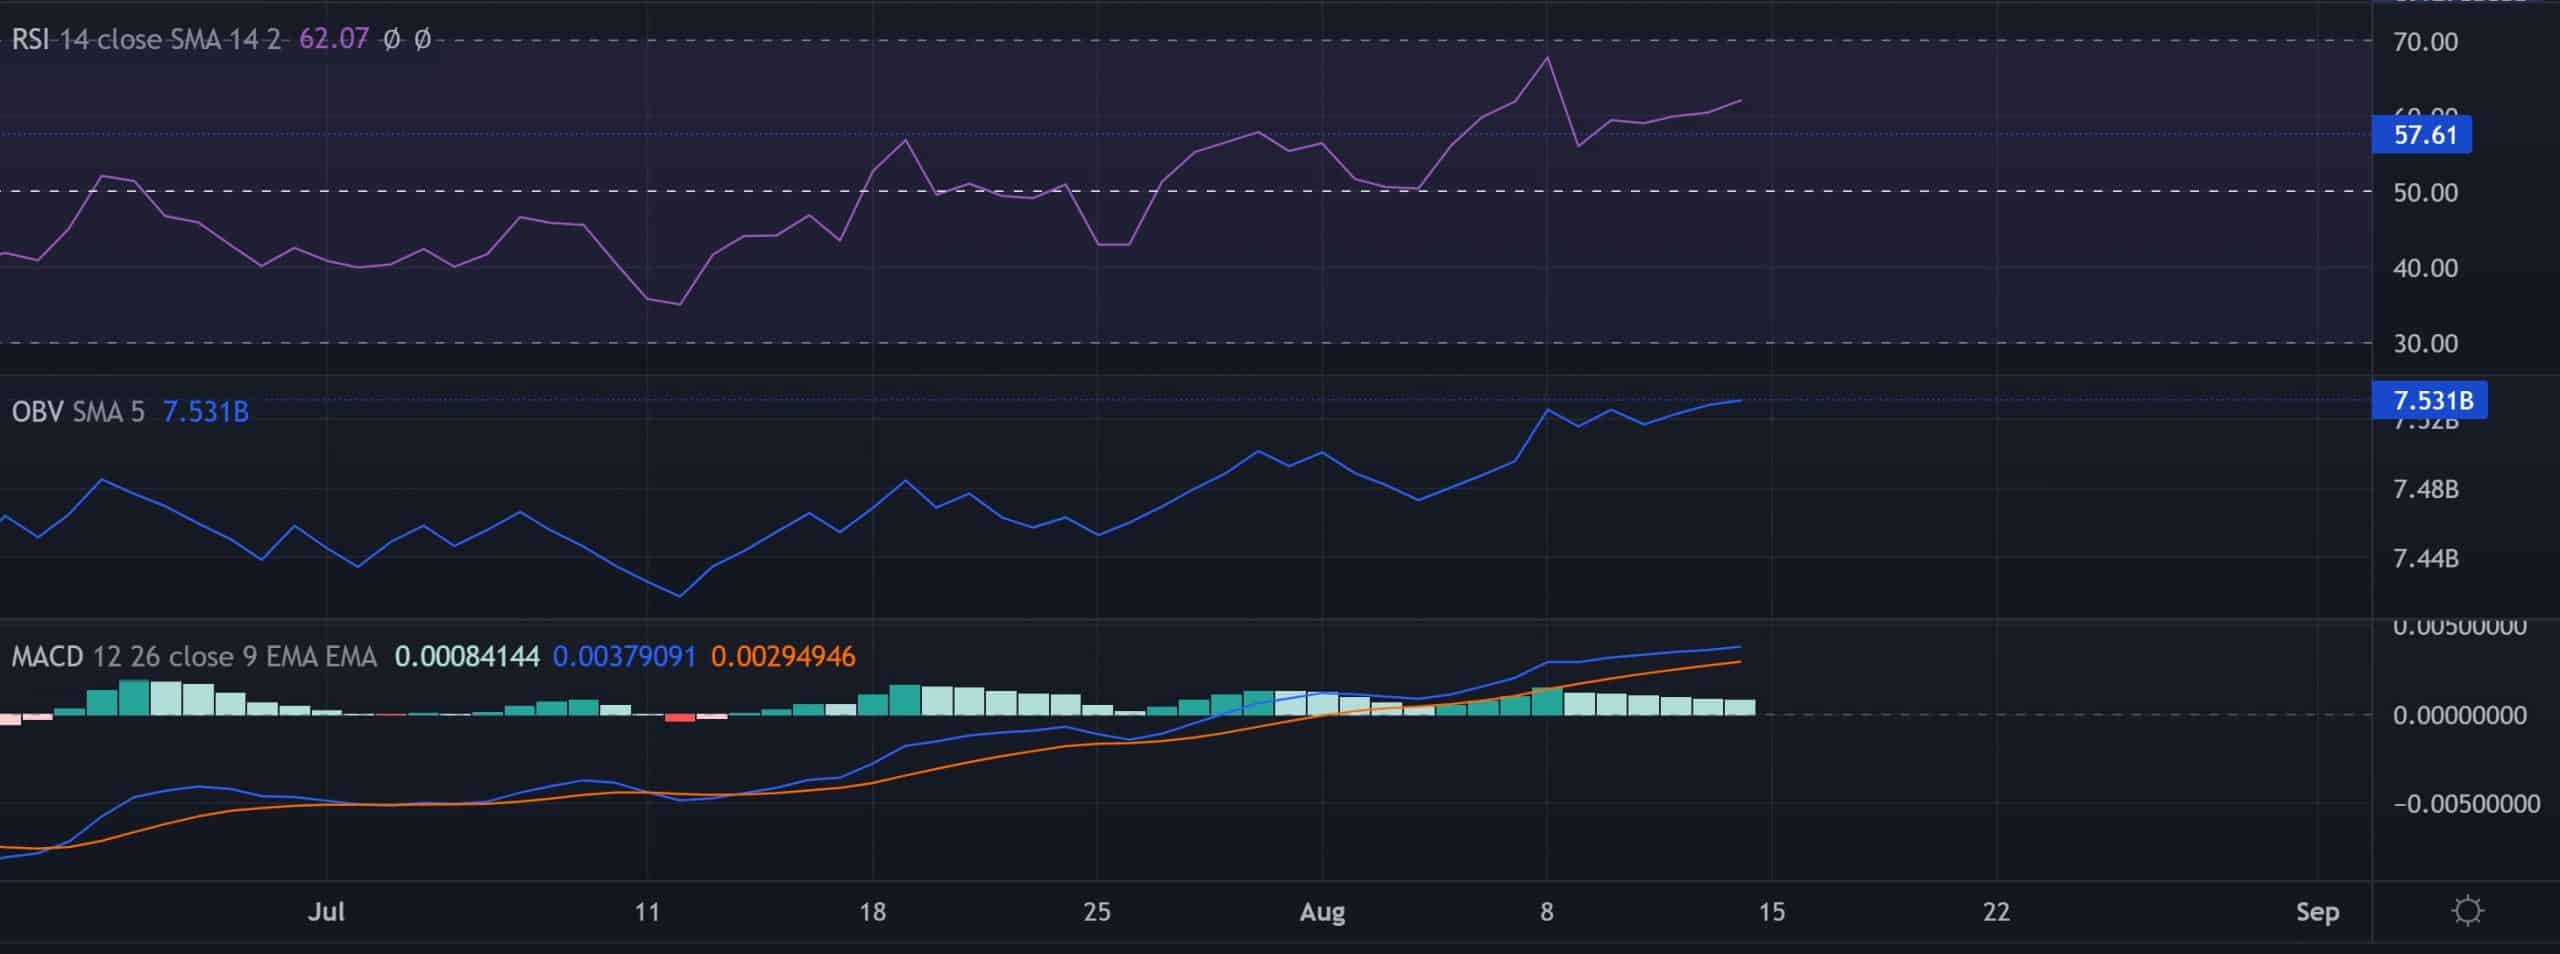
The Relative Strength Index exhibited a bullish preference after flipping the 57-mark to immediate support. A close below this mark could indicate the possibility of a plausible decline.
Furthermore, the OBV resonated with increasing buying pressure, but saw higher peaks over the last few days. So, any reversals on the OBV could affirm a bearish divergence.
The MACD lines projected a strong buying edge while they swayed above zero. Traders/investors must watch for a bearish crossover before short-selling the crypto.
Conclusion
Considering the rising wedge structure approaching the $0.13-ceiling, sellers would look to step in. A close below the pattern could further aggravate the selling inclinations. The targets would remain the same as discussed.
Also, investors/traders should factor in broader market sentiment and on-chain developments to make a profitable move.


