Here’s what could determine Ethereum’s trajectory over the coming days

The global cryptocurrency market took yet another beating in what was its seventh straight bear market in a row. The world’s largest altcoin-Ethereum was also under the pump and lost ground on its phycological $2,000 level. With a down-channel still active on its 12-hour chart, prices could dip lower and find safe haven in a support zone between $1,730 and $1,915.
Ethereum 12-hour chart
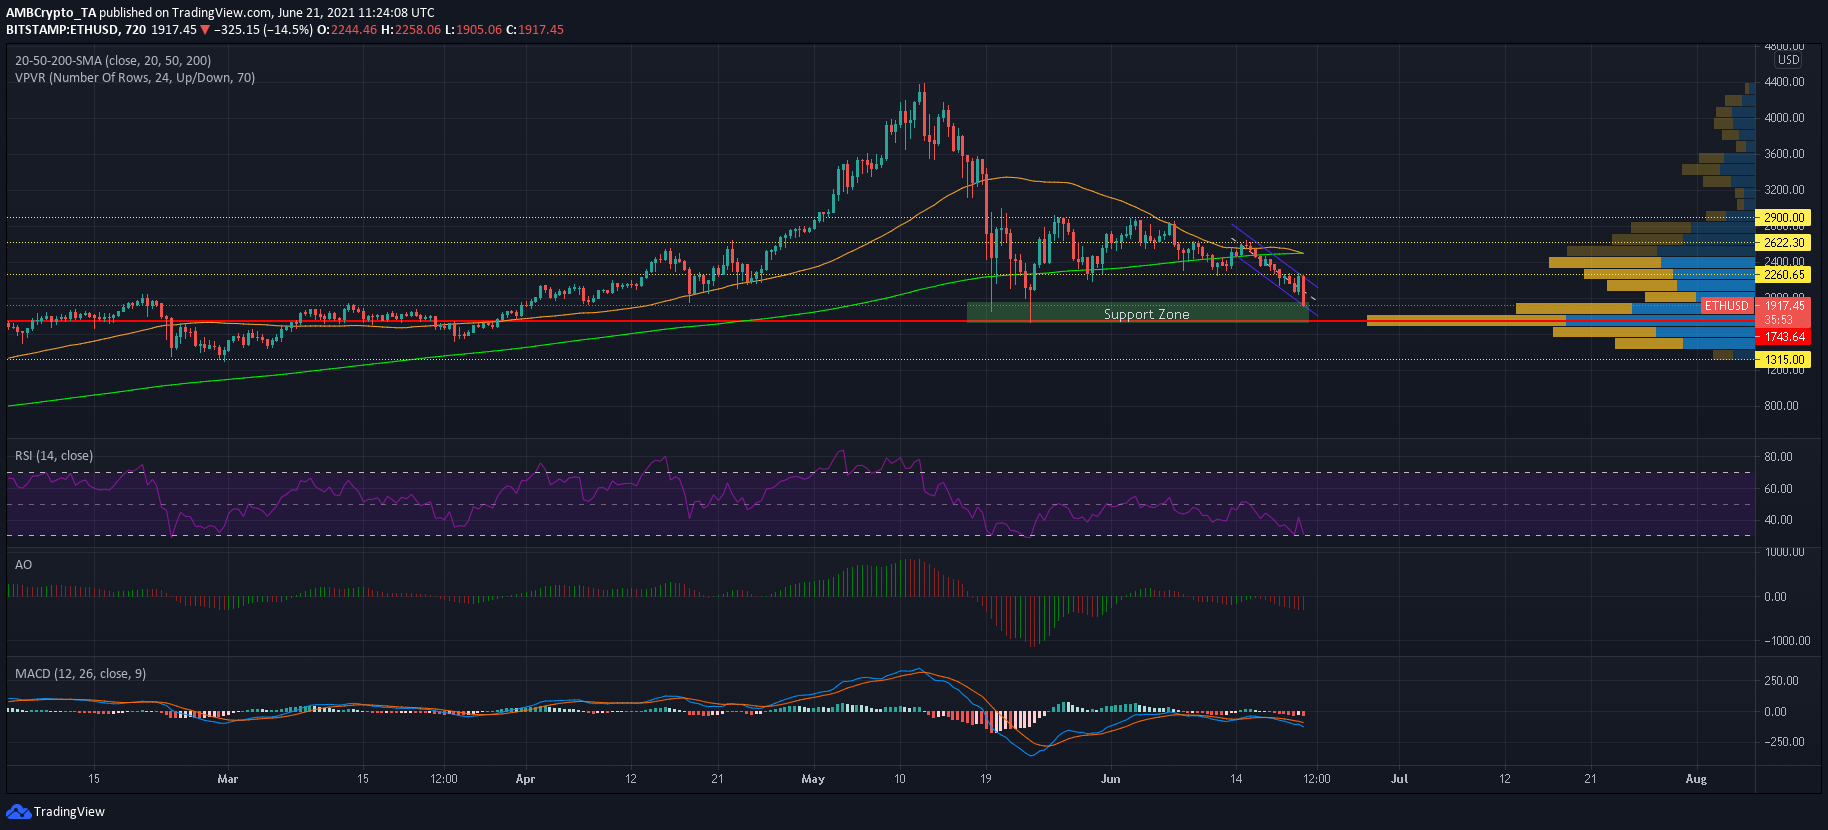
Ethereum’s chart highlighted a breakout attempt from its down-channel but the same was denied at $2,260-resistance. With sellers back in control, ETH slipped back in its pattern and eyed a move into its support zone of $1,730-$1,915. This area was not only critical to ETH’s recovery but would also determine its trajectory over the coming days. Cutting losses in this region would likely result in a breakout back towards $2,260.
Any further upside could be denied by the 20-Simple Moving Average which acted as a resistance line. On the other hand, failing to cut losses between the defensive region could drag ETH all the way towards its 28 Feb swing low of $1,315.
Reasoning
Momentum was clearly on the bearish side, as highlighted by both Awesome Oscillator and MACD. Relative Strength Index has failed to rise above 50 as weakness has persisted in the market since 19th May. However, a fall to the oversold region does warrant a reversal which would lead to pick-up in prices. The question that remains is whether ETH’s support zone would alleviate incoming selling pressure.
The Visible Range highlighted a point of control at $1,743. At this price point, trading interest for ETH as at its peak in the given timeframe, and a further breakdown was unlikely. In case of a breakout from its pattern, bulls would likely target a rise back towards $2,260 but there was no guarantee whether ETH would be able to sustain this level.
Conclusion
Ethereum’s downtrend could drag the digital asset within a support zone of $1,730 and $1,915- an area where buyers would most likely return to the market. Visible Range highlighted a point of control at $1,743 and an extended sell-off could be avoided. If bears do dominate over the coming days, ETH could fall back towards its late-February levels of $1,320.