Here’s when it’s time for Cardano’s traders to worry

Disclaimer: The findings of the following analysis are the sole opinions of the writer and should not be taken as investment advice
There have been some troubling signs in the Cardano market of late. Bearish patterns on both ADA’s price and its indicators, coupled with a broader market sell-off, led to severe losses. Heavy waves of selling pressure were evident in the market as ADA recorded its biggest daily percentage loss since 21 June, with a single candlewick even dropping as low as $2.00.
Various support levels were now under pressure to subdue selling pressure and if buyers are not careful, ADA would suffer another 22% drop in value.
At the time of writing, ADA was trading at $2.39 with market cap of $79.89 Billion.
Cardano Daily Chart
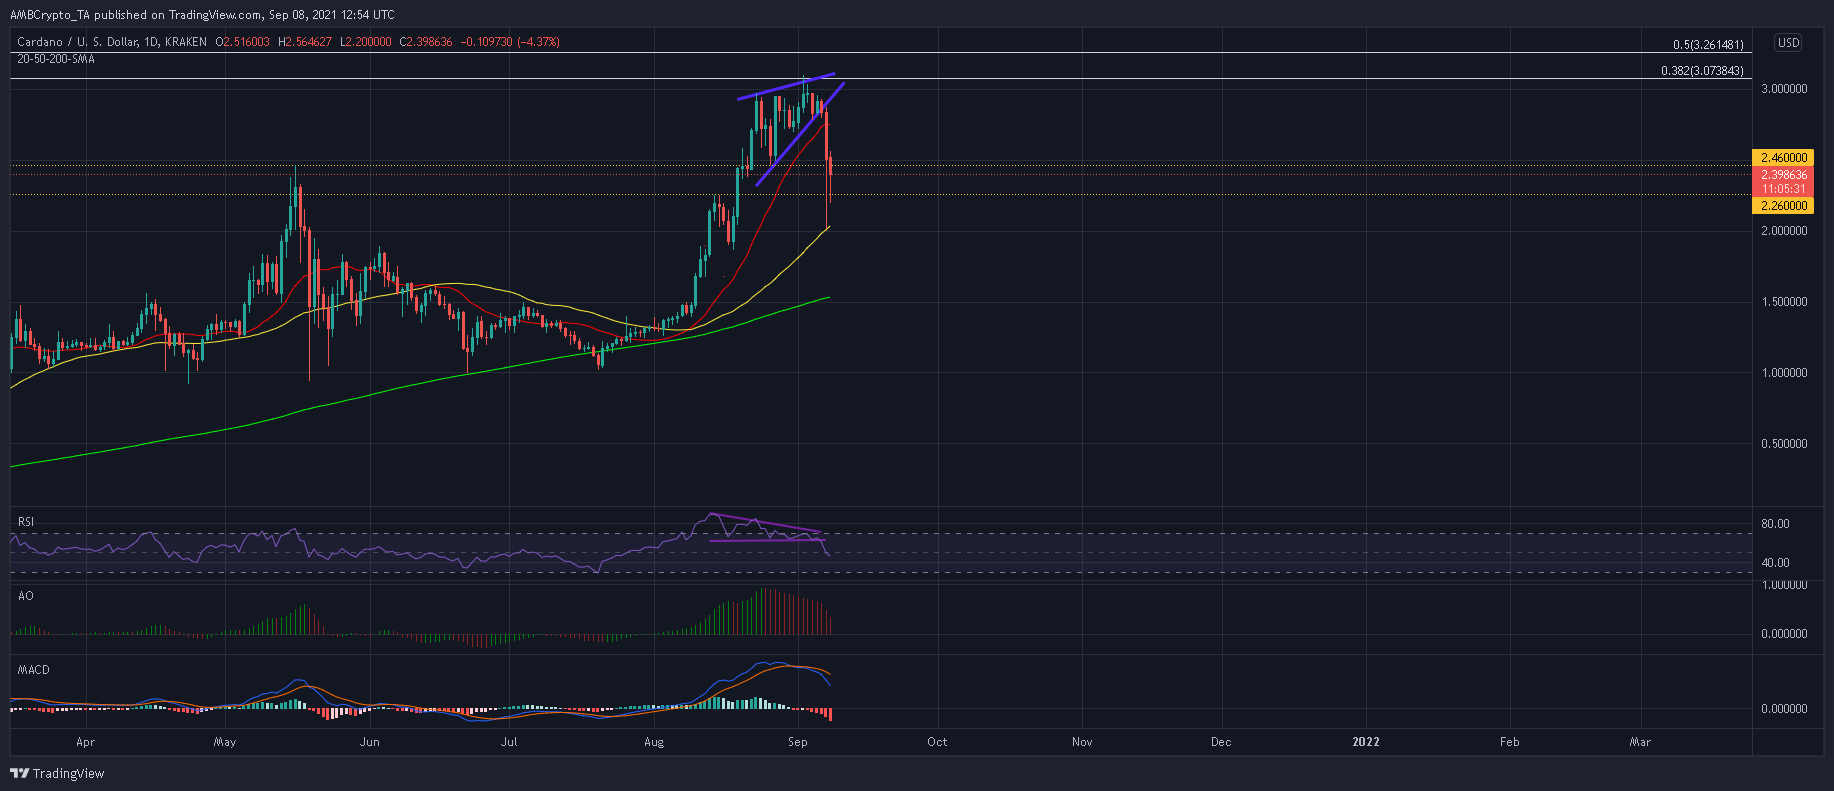
Cardano’s plummet was well within expectations after a rising wedge appeared on its daily and 12-hour charts. A breakdown resulted in a large red candle with an even larger candlewick which dropped as low as $2.00 and towards the 50-SMA (yellow).
Although today’s session opened at $2.51, the candle had breached the defensive region of $2.46 and looked to extend losses. For a bullish revival, the support area present at $2.26 would be key to ADA’s success. In fact, the 4-hour timeframe (not shown) indicated that buying pressure has been slowly creeping in at the aforementioned level.
However, this does not necessarily mean that ADA would retest $3 anytime soon. There are chances of reactionary buying over the next 24 hours, but expect sellers to largely keep prices in check. Going forward, the range between $2.20-$2.56 could become prominent as ADA stabilizes.
On the other hand, a close below $1.88 would shatter ADA’s bullish long-term outlook.
Reasoning
The daily RSI broke south from a bearish descending triangle and tipped below its equilibrium. The mid-line has often functioned as support/resistance and it’s early to call for an extended decline.
The Awesome Oscillator registered a 14th straight red candle as buying pressure has been on a constant decline since late-August. This translated to a bearish crossover on the MACD, its first since 11 July.
Considering the fact that both the Awesome Oscillator and MACD were trading at exuberant levels, the current stabilization can be considered healthy over the long run.
Conclusion
As ADA looks to cut losses above the $2-mark, the price could steady itself between $2.20-$2.58 in the coming days. Reactionary buying could push the price a little higher, but expect this move to be short-lived as ADA’s indicators reset before the next swing.
However, traders must be cautious of a close below $1.88 as this would put the market under severe risk of another strong sell-off.


