History suggests Cardano’s price action is set to do this before Alonzo

Cardano (ADA) was one of the few cryptocurrencies that wasn’t strongly affected by the early June price dips. In spite of the massive fall in Bitcoin’s price, ADA strongly held the $1.45 and $1.3 support levels as it instead chose to move sideways on the charts. Alas, the fifth-ranked alt couldn’t hold itself together when Bitcoin’s price fell below the 30k level, with ADA’s losing 25% of its value from 7 July to 20 July.
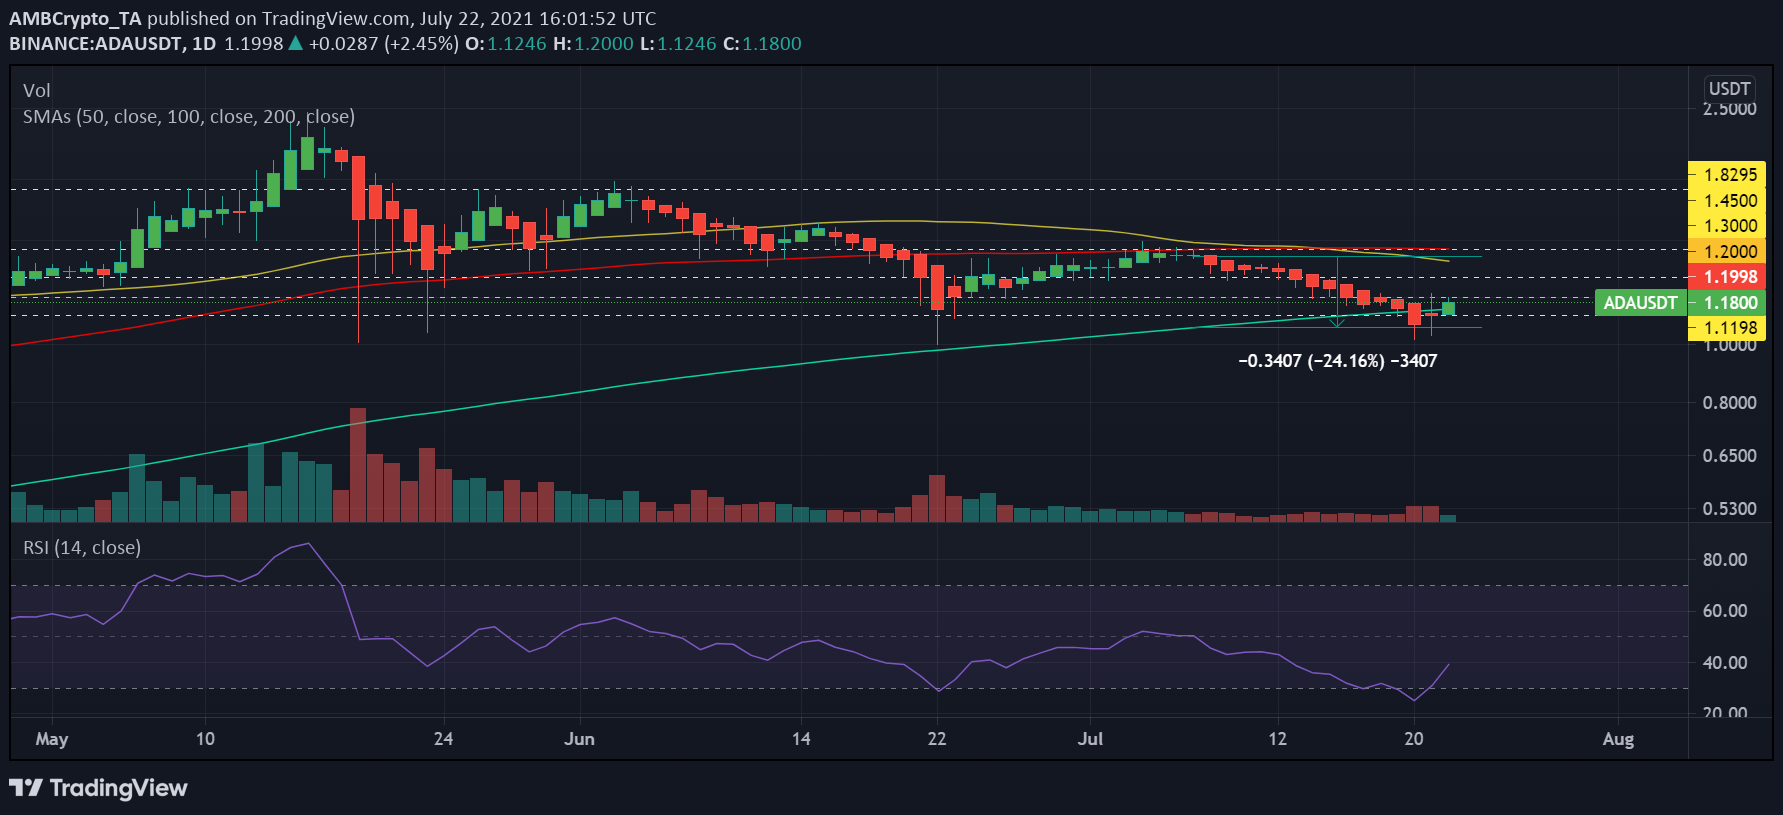
It’s a known trend that the larger crypto-market follows Bitcoin, but there have been exceptions in the past and one such exception was Cardano. However, this time, ADA is more or less seen mirroring Bitcoin’s price. In fact, Cardano retested the long-term buying range of $1 for the sixth time this year.
While Cardano noted a swift recovery at one point and hiked by 13% in just two days, the alt’s fall to $1 levels was a sign that there could be further room for a decline. In hindsight, it was also notable that ADA was trading near $0.80 in the middle of February. However, a closer look at the alt’s one-day chart highlighted its recovery from the oversold zone on 21 July.
Another close above the 200-day SMA would signal better recovery for ADA.

Source: USDT/ADA Trading View
Here, it’s worth mentioning that this year, before the Cardano hard forks took place, ADA’s price registered some notable rallies. But, will that be the case now too before the Alonzo hard fork completes in August? Analyst Dan Gambardello recently charted out Cardano’s recovery plan and pointed out that the ultimate short-term goal for Cardano is “to get back above that $1.37 area on a weekly chart and close green above the 20-week moving average.”
He further pointed out the confluence of a falling wedge and a descending triangle pattern on Cardano’s daily chart. Charting the breakout target around the $2 range, he said,
“If Cardano is to break away, the breakout target for the descending triangle will be closer to the $2.30 range but either way it’s two bullish targets to the upside falling wedge and the descending triangle. We’ve been tracking upper trend line right around $1.26, Cardano could be testing this upper trend line very soon.”
Further, stressing on the rallies in ADA’s price before each hard fork, the analyst said that it is inevitable this time too. The green areas in the chart below highlight price rallies in ADA before the Mary and Shelley hard forks. Thus, another possible rally in the coming two months fueled by the Alonzo hard fork wouldn’t be a surprise.

Source: Crypto Capital Venture
So, does that mean Cardano is prepping for a rally?
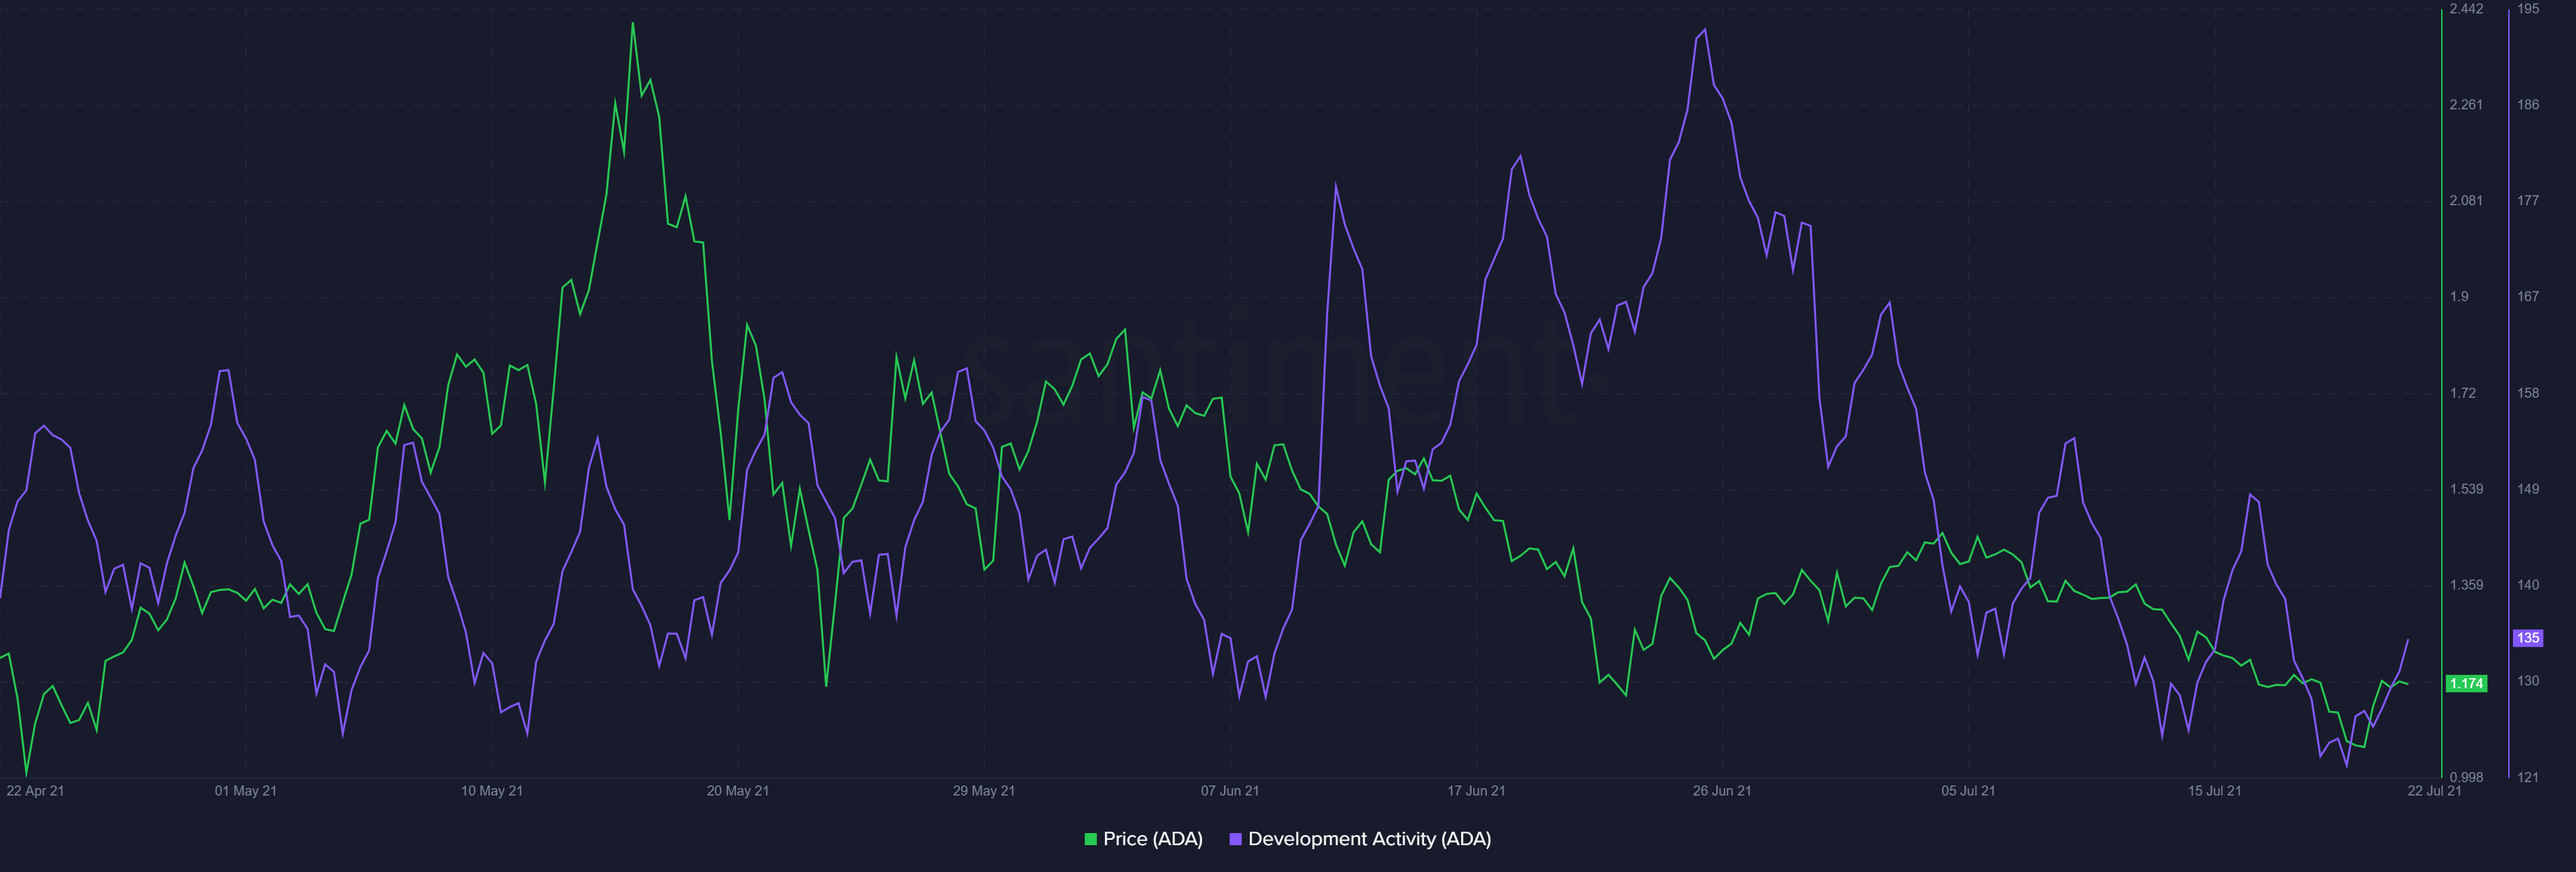
Well, while it might seem that Cardano is in for some solid gains in the mid-short term future, some metrics present another side of the story. On the development side, for instance, activity is still low, when compared to its June levels. Further, a downward trend in development activity making lower highs was spotted for ADA.

Source: Sanbase
Additionally, trade volumes and the percentage of the stablecoin total supply held by whales with more than 5 million USD, were still low. Stablecoin total supply percent saw a downtrend, irrespective of the price rise that accompanies BTC’s own hike. Likewise, weighted social sentiment on Twitter also saw some surprising peaks and dips in just one day.
In fact, at the time of writing, the indicator was at the end of a major dip.

Source: Sanbase
All said and done, where Cardano’s mid to short-term price action is concerned, some good rallies can be seen if the alt breaks away from its key resistance levels, converting them to support.


