How Polkadot managed to remain bullish while broader markets saw fear

Disclaimer: The findings of the following analysis are the sole opinions of the writer and should not be considered investment advice
A recent report explored whether Polkadot formed a cup-and-handle pattern and was preparing for a sharp move upward. The selling pressure across the market in the past few days ensured that such a move did not materialize. However, the bulls still had some sway in the market. Yet, it must be remembered that Bitcoin could have a strong influence on the direction of DOT in the weeks to come.
DOT- 1 Day Chart
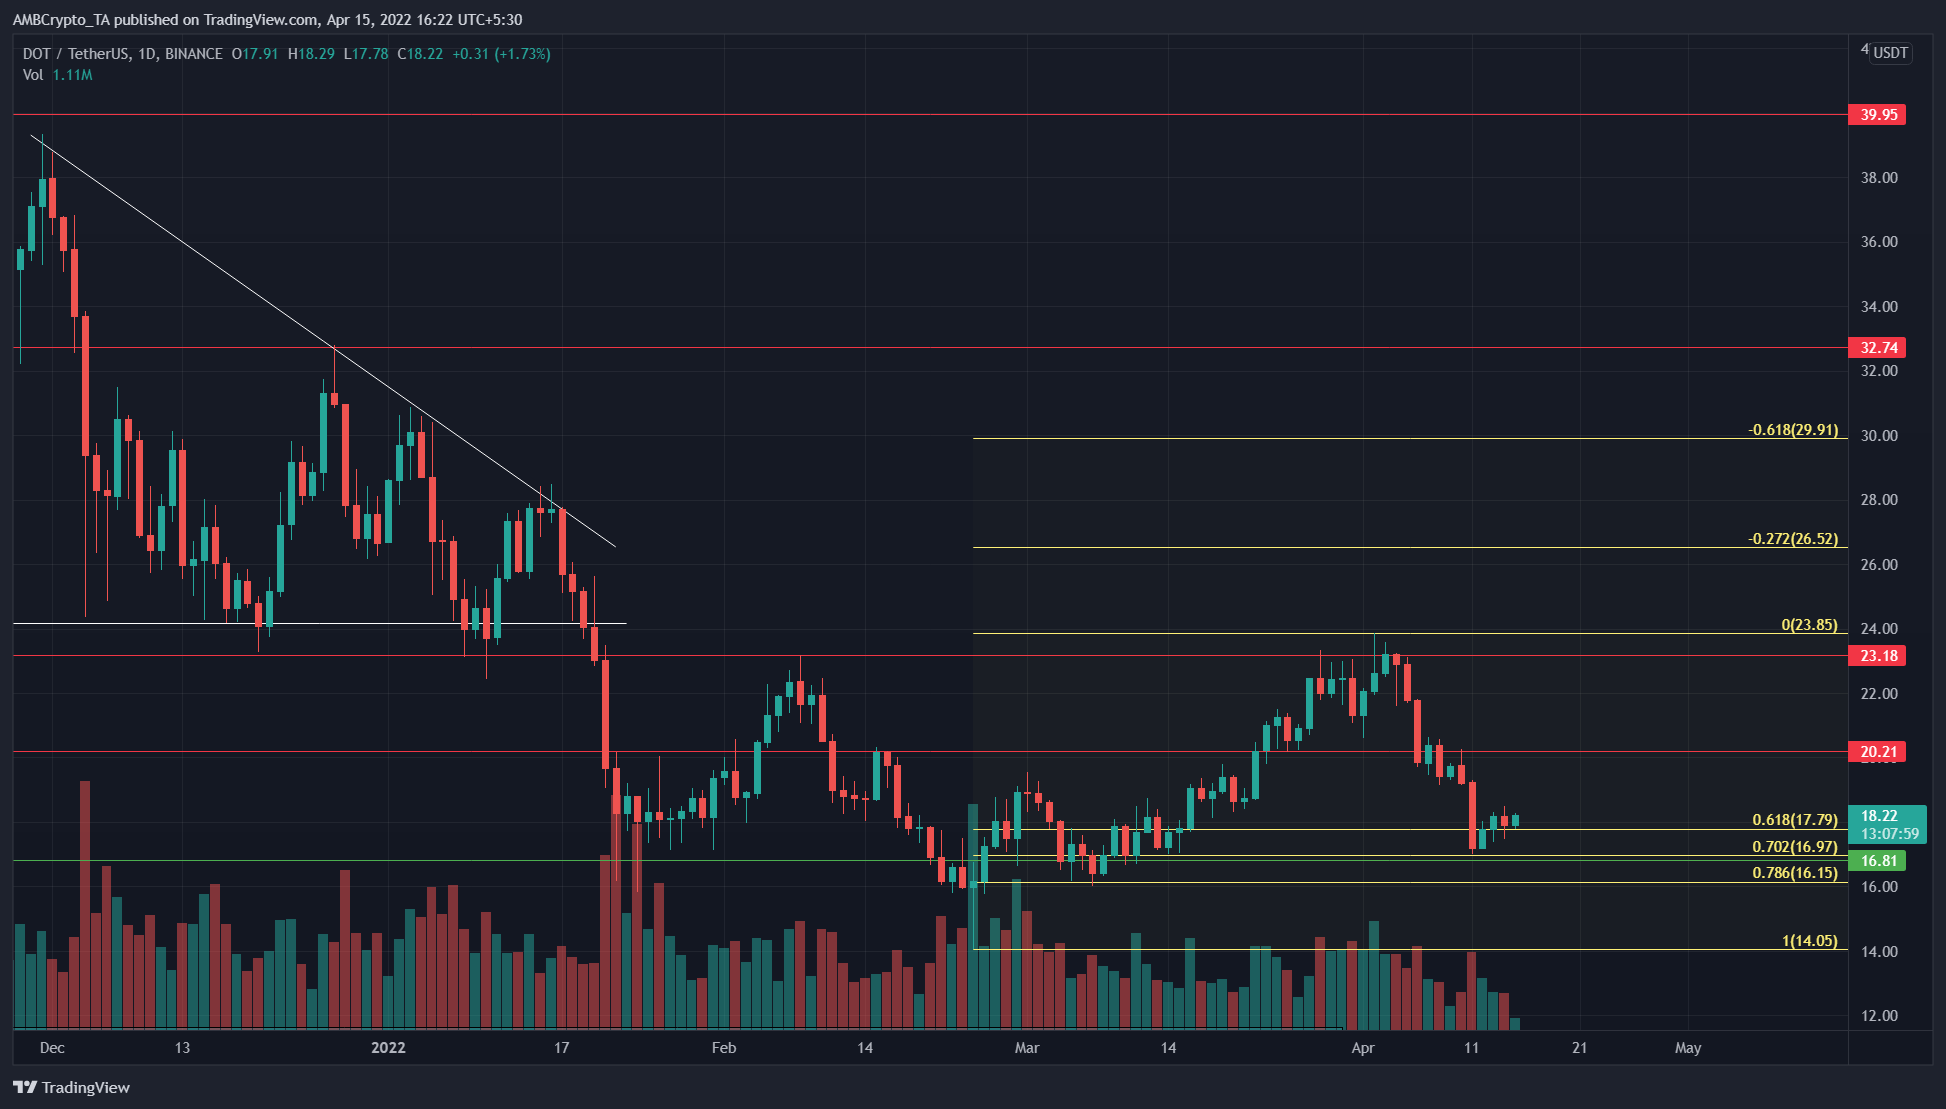
In late December, DOT fell out of a descending triangle pattern (white) and plunged to $16. The past few months have seen the price oscillate between the $16 lows and the $23.18 resistance level.
In late March, the price was able to poke above the $23.18 level, which is a higher high and the start of a potential uptrend.
A set of Fibonacci retracement levels (yellow) were plotted from the swing low at $14.05 to the $23.85 swing high. The 61.8% and 70.2% retracement levels have been tested as support.
A buying opportunity can be found in the $16.15-$17.79 area, with the $23.85 and the $26.52 as potential price targets.
Rationale
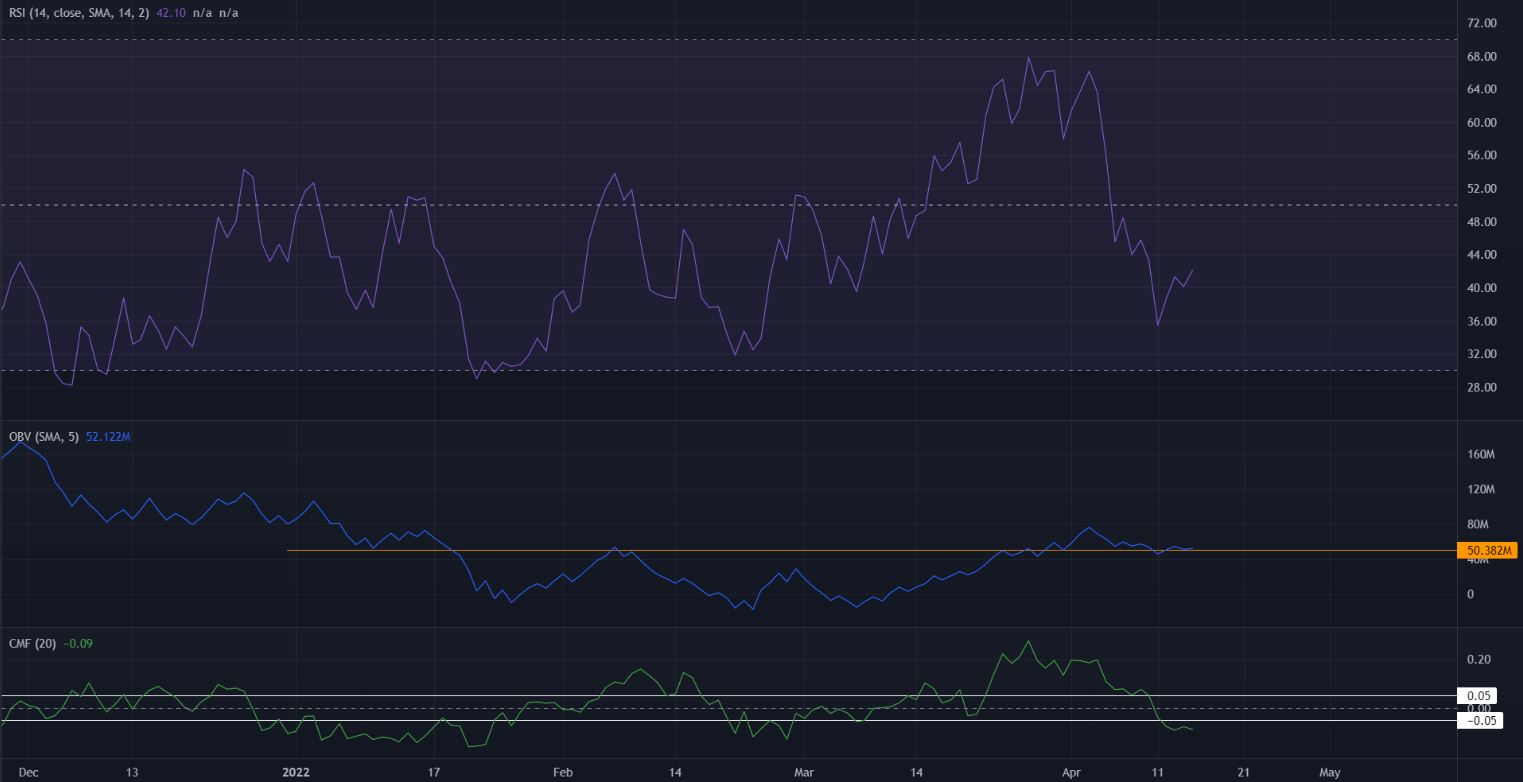
The RSI dropped below 50 in response to the strong drop from $23 in the past two weeks. With a reading of 42, the momentum was not quite strongly bearish, nor was the trend on the daily bearish according to the RSI.
The CMF also slipped beneath the -0.05 level in response to the recent wave of intense selling. However, the OBV offered some solace to the bulls. It has not dropped beneath a level that had been resistance in February, which meant that buyers still had some control over the direction of DOT.
Conclusion
Polkadot has a bullish outlook for the next few weeks, provided Bitcoin does not see a strong drop beneath the $39k level. This could spark further fear in the market. From a technical perspective, the market structure leaned toward the bullish side. However, a drop beneath $16.15 could shift this bias.


